Most investors check five or six different websites before they make a decision. One shows who is buying gold futures, another tracks the dollar, a third has Pakistan’s inflation numbers, and yet another lists PSX company results. By the time everything is lined up, the moment has often passed.
Market Pulse Hub was built to fix that. It is a single dashboard that brings together the signals that move markets, from global futures positioning to Pakistan’s economy and individual PSX stocks, and keeps them updated for you automatically. This article walks through every part of the dashboard with real screenshots, so you know exactly what you get.
Why we built it
Good market decisions usually come from combining a few strong pieces of evidence: what large traders are doing, where the macro picture is heading and whether a company is fundamentally sound. That evidence exists, but it is scattered, hard to read and often buried in raw tables.
Market Pulse Hub collects it, cleans it and turns it into clear scores, charts and signals. The goal is simple: spend less time gathering data and more time thinking about what it means.
The dashboard has two main areas. Forex covers global futures positioning and currencies. PSX / KSE-100 covers Pakistan’s economy, the stock market and individual companies.
Part 1: Global futures positioning
The screener: 51 markets on one page
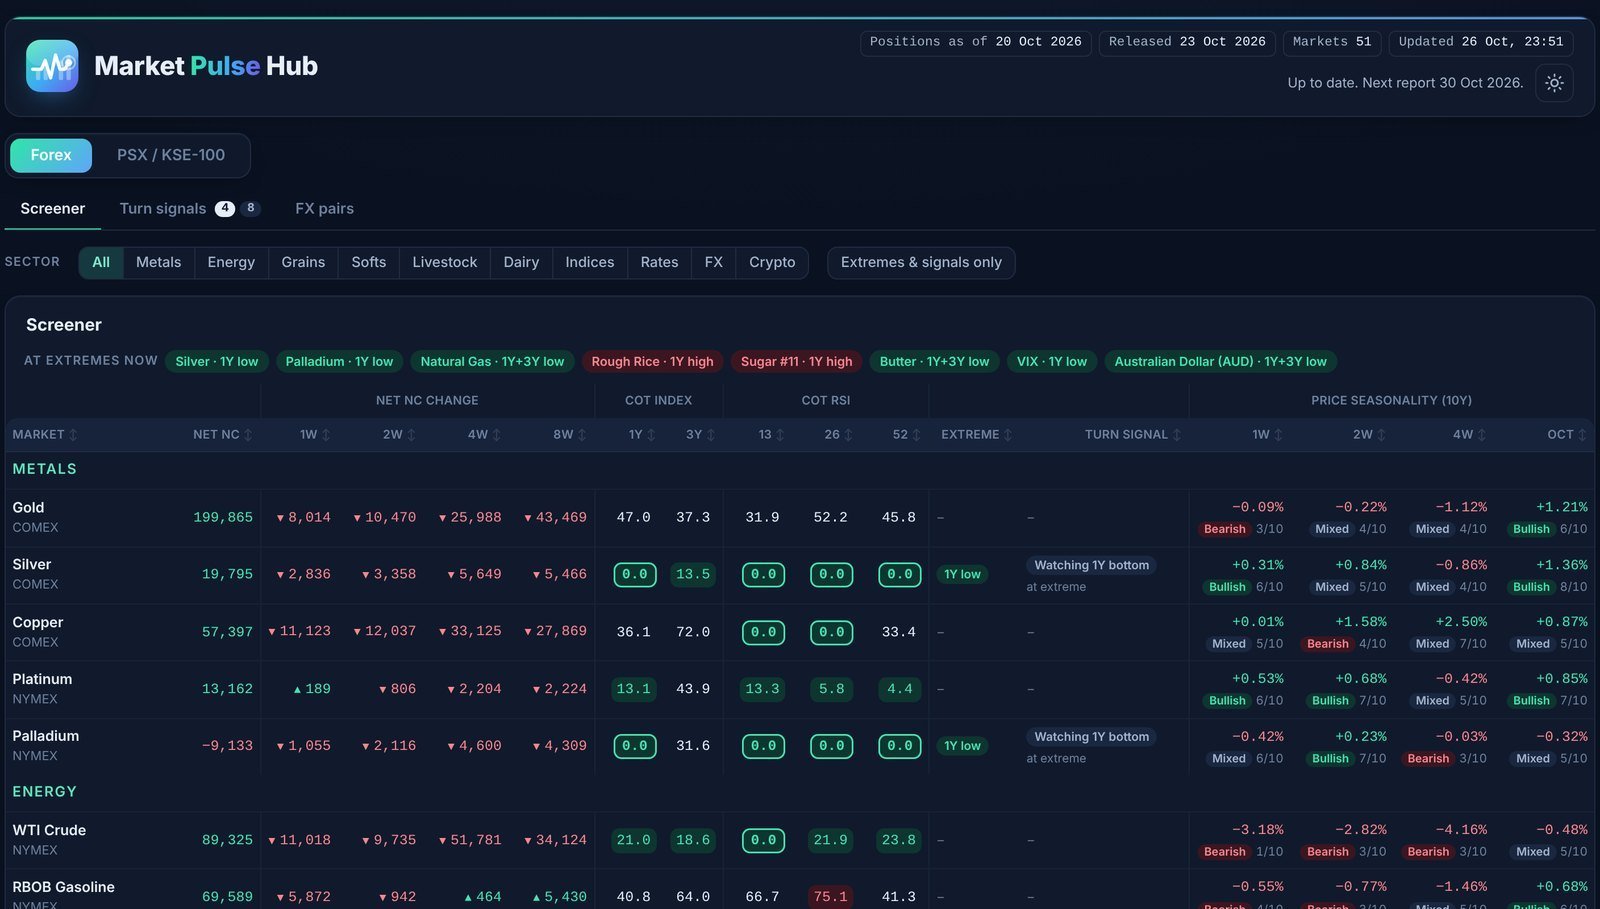
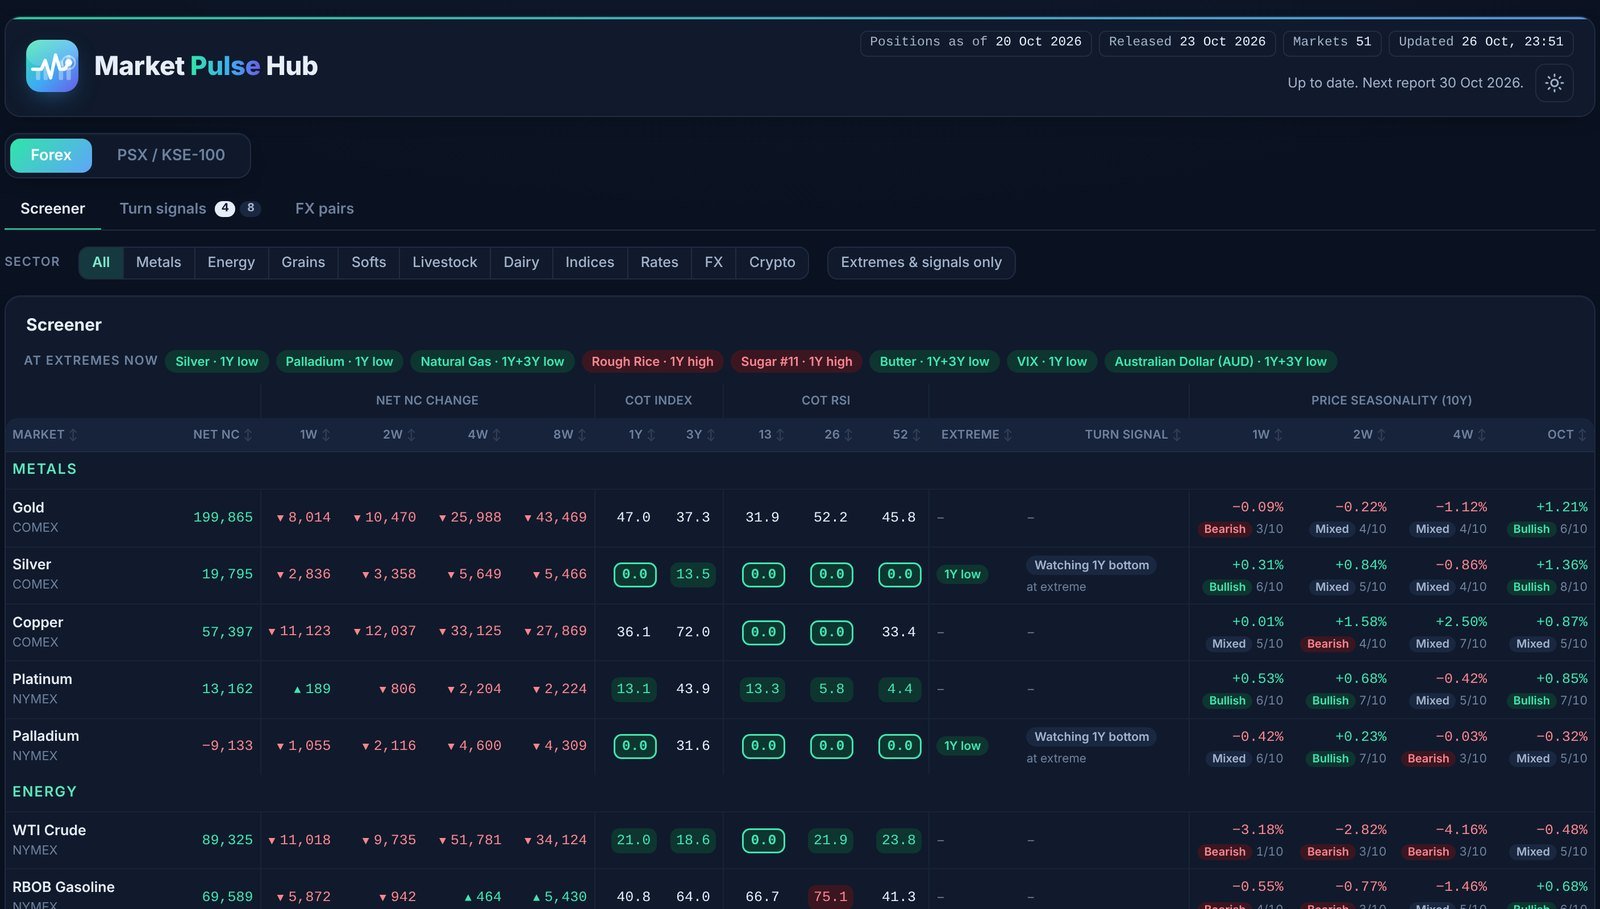
Every week the US Commodity Futures Trading Commission (CFTC) publishes the Commitments of Traders (COT) report. It shows how large speculators, commercial hedgers and smaller traders are positioned in each futures market. Market Pulse Hub tracks 51 markets across metals, energy, grains, softs, livestock, dairy, stock indices, interest rates, currencies and crypto.
For every market the screener shows:
- Net positions of large speculators and how they changed over the last 1, 2, 4 and 8 weeks.
- COT Index over 1 and 3 years, which tells you where today’s positioning sits within its historical range (0 is the most bearish, 100 the most bullish).
- COT RSI over 13, 26 and 52 weeks, a momentum reading on positioning.
- Extremes and turn signals, highlighted when positioning hits a 1-year or 3-year high or low.
- Price seasonality for the next 1, 2 and 4 weeks and the current month, based on the last 10 years, with how many of those years went up.
Sector filters and an “Extremes and signals only” switch let you cut the list down to what matters this week, and the “At extremes now” row at the top lists every market currently at an extreme.
Market detail charts
Click any market to open its detail view. You see the full history of net positions, with large speculators shown as bars and commercial hedgers as a line, plus the COT Index and COT RSI over time.
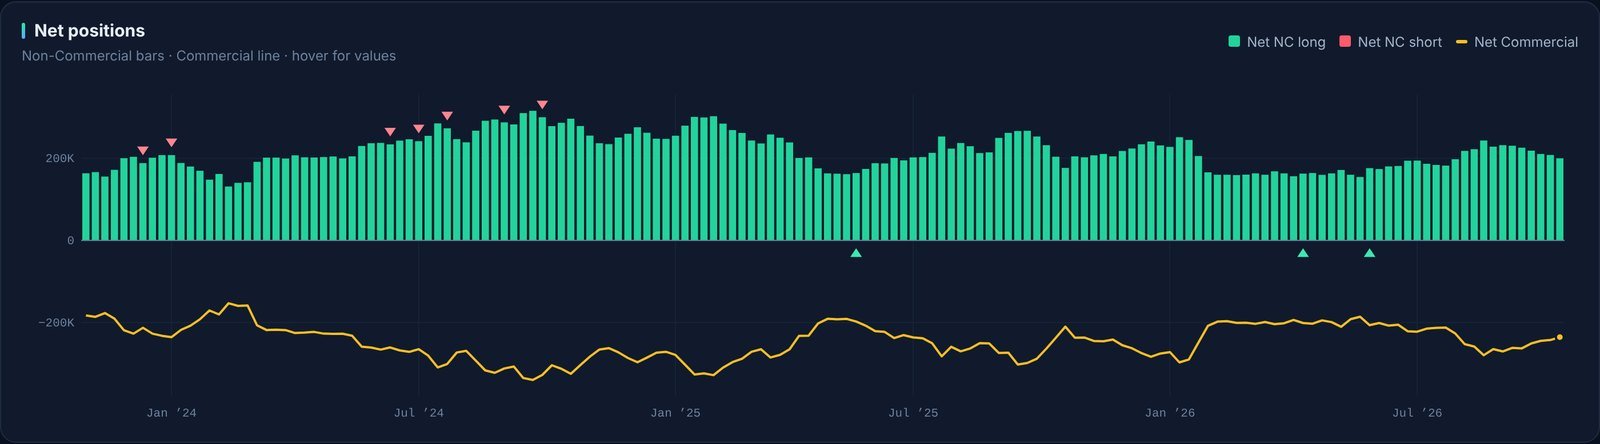
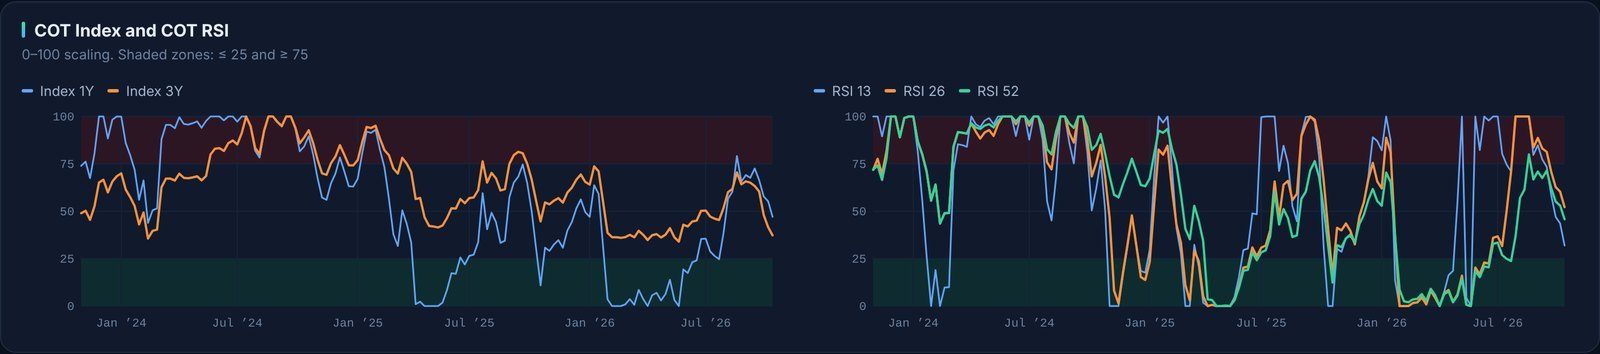
The detail view also includes open interest against price, price seasonality, a COT seasonality strip and the full history of past turn signals for that market, so you can see how reliable signals have been before.
Turn signals
Extremes on their own are not enough: a market can stay stretched for weeks. The Turn signals page shows the moment positioning actually starts to reverse from an extreme.
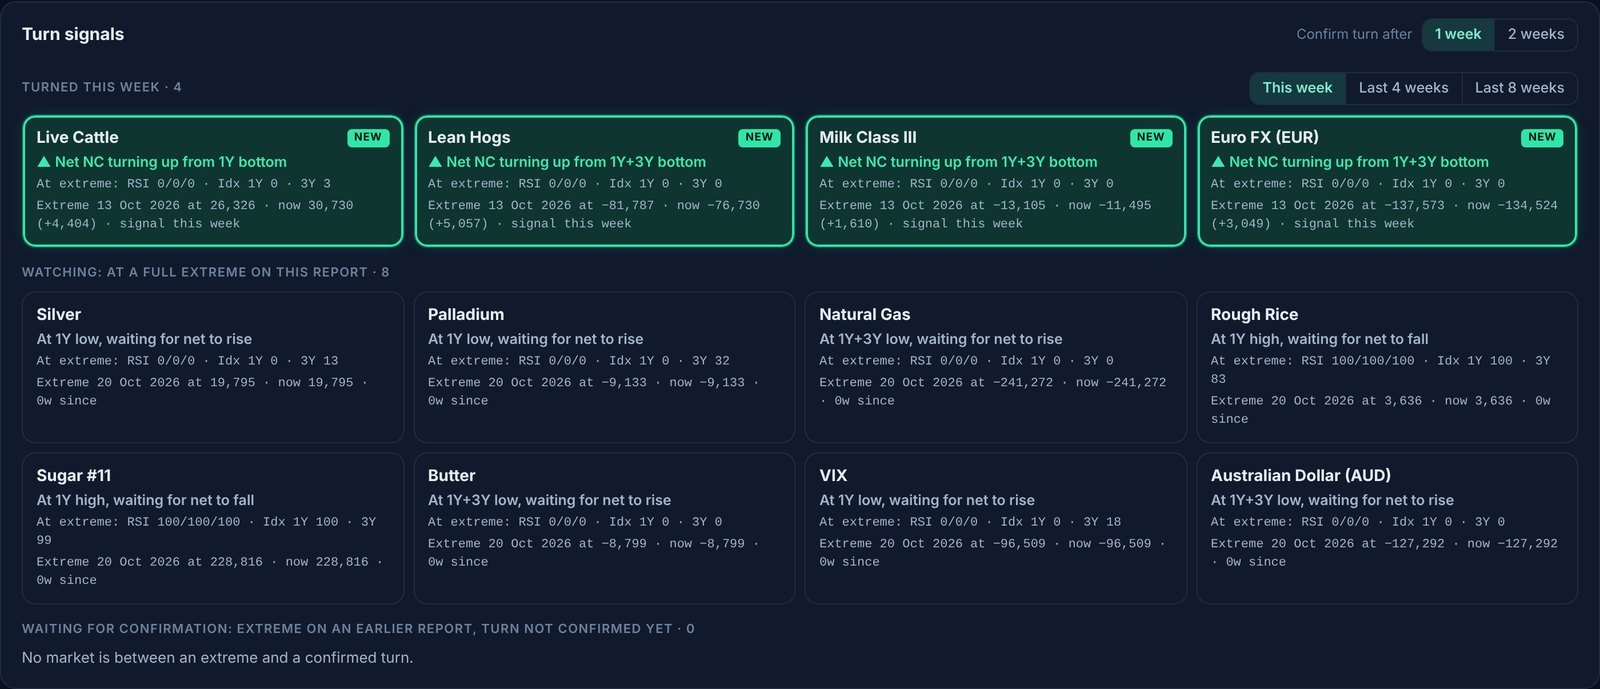
Signals are grouped into three lists:
- Turned this week: positioning has started to move away from a 1-year or 3-year extreme.
- Watching: markets at a full extreme on the latest report, waiting for positioning to turn.
- Waiting for confirmation: a turn that began on an earlier report but has not been confirmed yet.
You can choose whether a turn needs one or two weeks to be confirmed, and look back over the last 4 or 8 weeks.
Currency strength and pair selection
Instead of looking at one currency pair at a time, the FX pairs page scores each major currency (USD, EUR, GBP, JPY, CHF, CAD, AUD and NZD) on several factors and combines them into one total score.
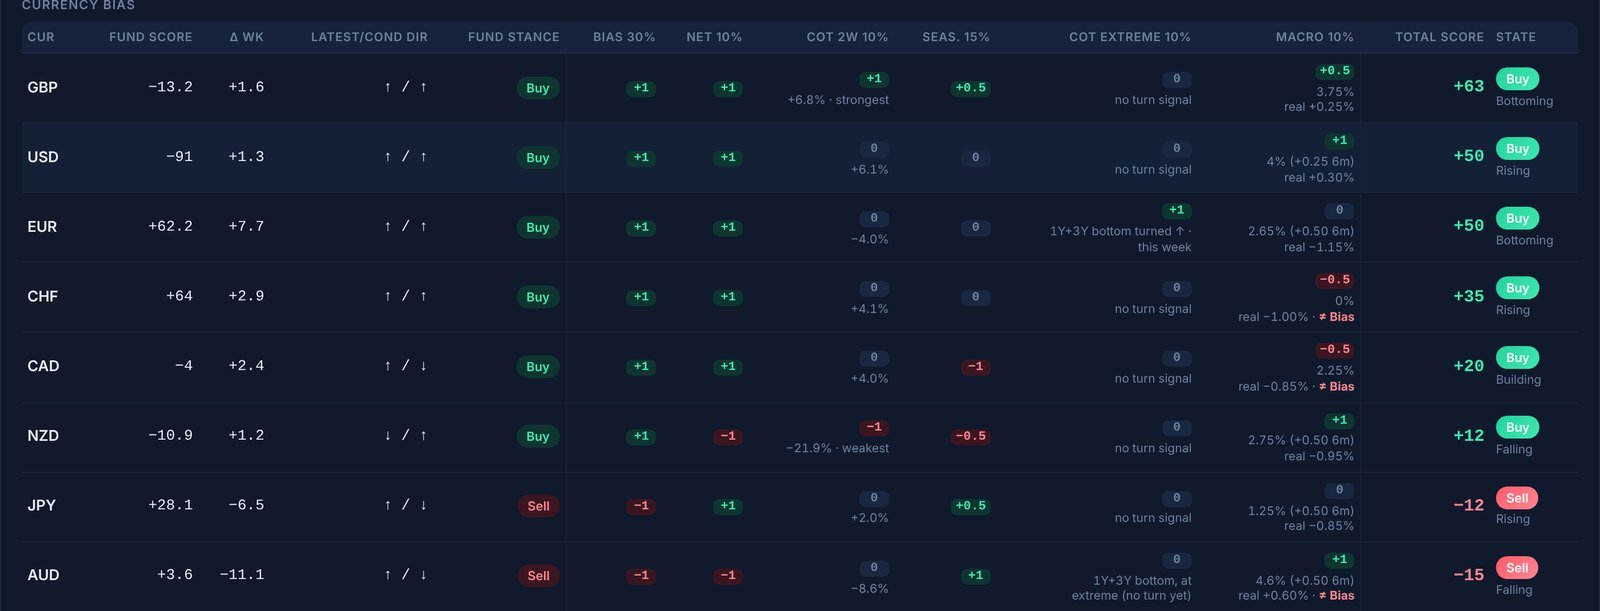
The score blends a fundamental bias with positioning changes, seasonality, positioning extremes and the macro picture (interest rates and real rates). Below it, a pairs watchlist matches the strongest currencies against the weakest, shows whether seasonality supports the trade, and lists the high-impact economic events coming up in the next seven days for each pair, such as central bank rate decisions.
Part 2: Pakistan’s economy and the KSE-100
Pakistan economy scorecard
Pakistan’s macro picture is rated every month across 9 factors: inflation, interest rates, bond yields, the oil price, fiscal performance (FBR tax collection against target), the current account, the rupee, central bank reserves and the rupee’s real effective exchange rate (REER).
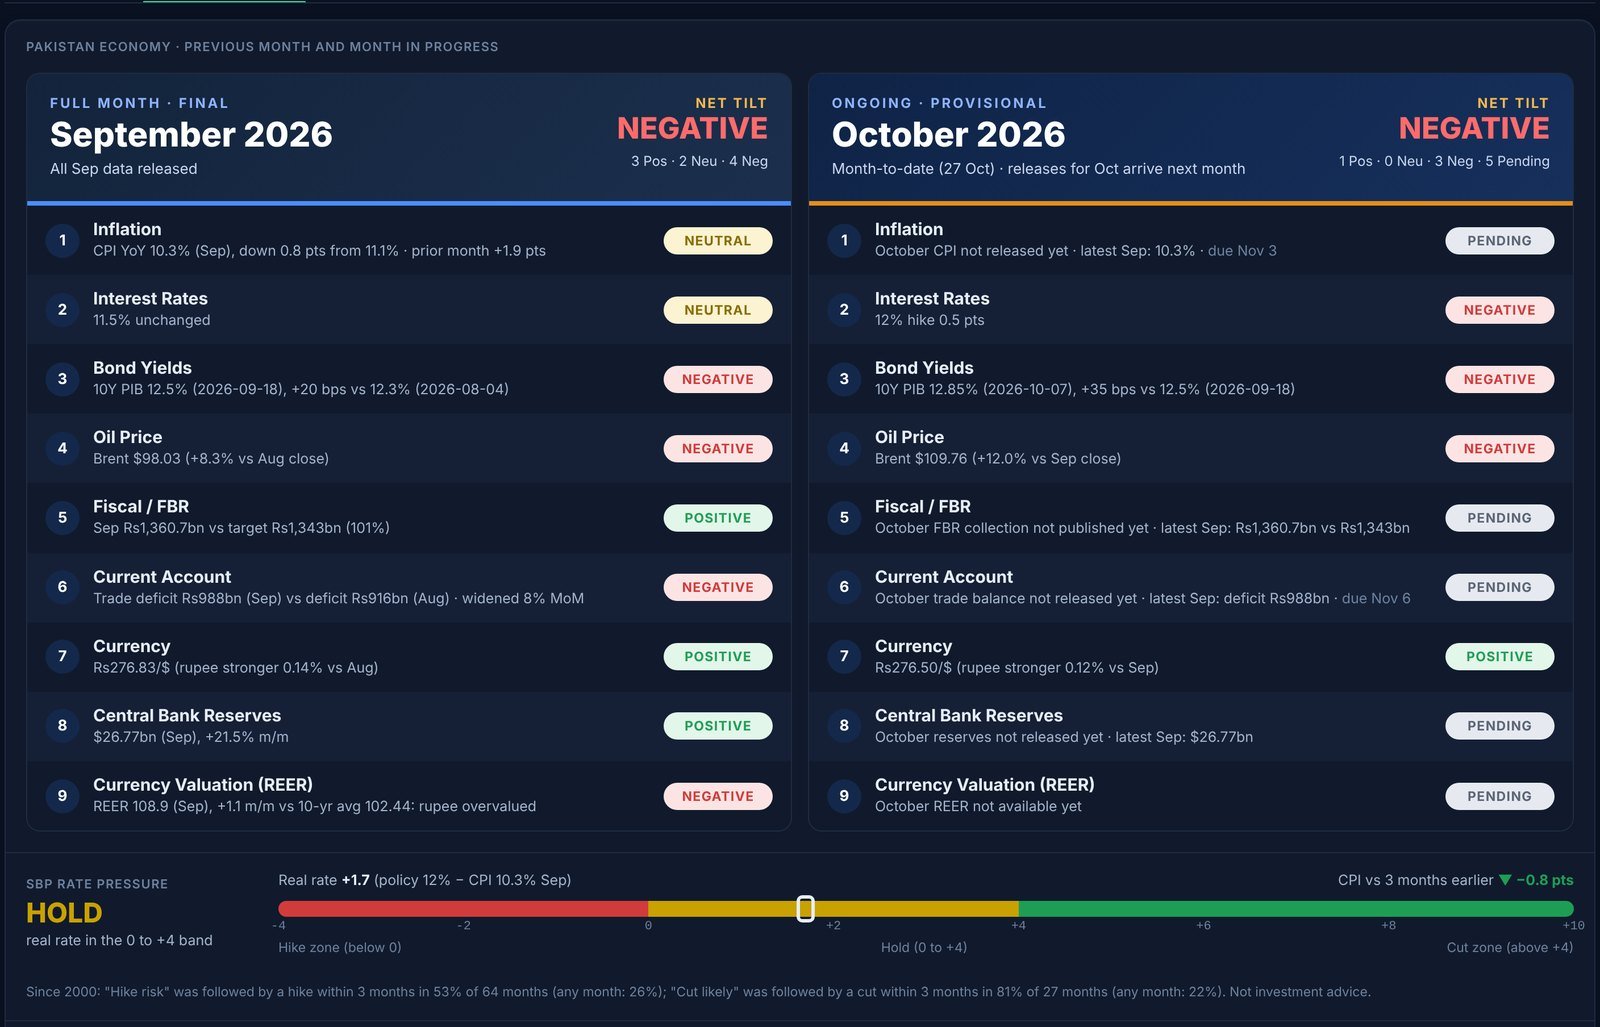
Each factor is marked positive, neutral or negative using clear rules. For example, inflation counts as positive only when it falls meaningfully or for two months in a row, and bond yields count as negative when they rise by 10 basis points or more. The overall tilt simply follows the majority.
The page shows two cards side by side: the last complete month, and the current month as data arrives, with factors not yet released marked as pending. Underneath, a policy rate pressure gauge compares the policy rate with inflation (the real rate) to show whether the next move is more likely to be a hike, a hold or a cut, followed by a 36-month history of every factor alongside what the KSE-100 did.
Leading indicators, economic regime and sectors
The Leading & Sectors page looks ahead. It tracks six indicators that tend to move before GDP and the stock market: consumer confidence, large-scale manufacturing output, real money supply growth, the yield curve, cement despatches and the REER.
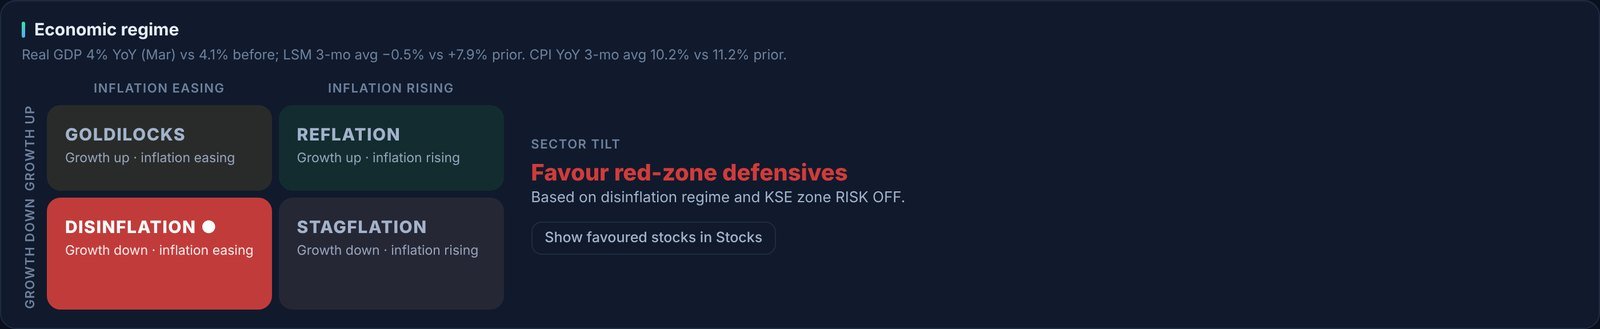
Growth and inflation trends place the economy in one of four regimes (goldilocks, reflation, disinflation or stagflation). Combined with the KSE allocation zone, this produces a sector tilt: whether cyclical sectors such as cement, autos and steel, or defensive sectors such as banks, oil and gas, fertilizer and power, are favoured right now.

KSE allocation
The KSE Allocation view helps you think about how much of a portfolio to keep in equities compared with fixed income. It plots the KSE-100 against the State Bank of Pakistan’s policy rate and inflation, and colours each period by regime: risk on, early risk on, caution or risk off.
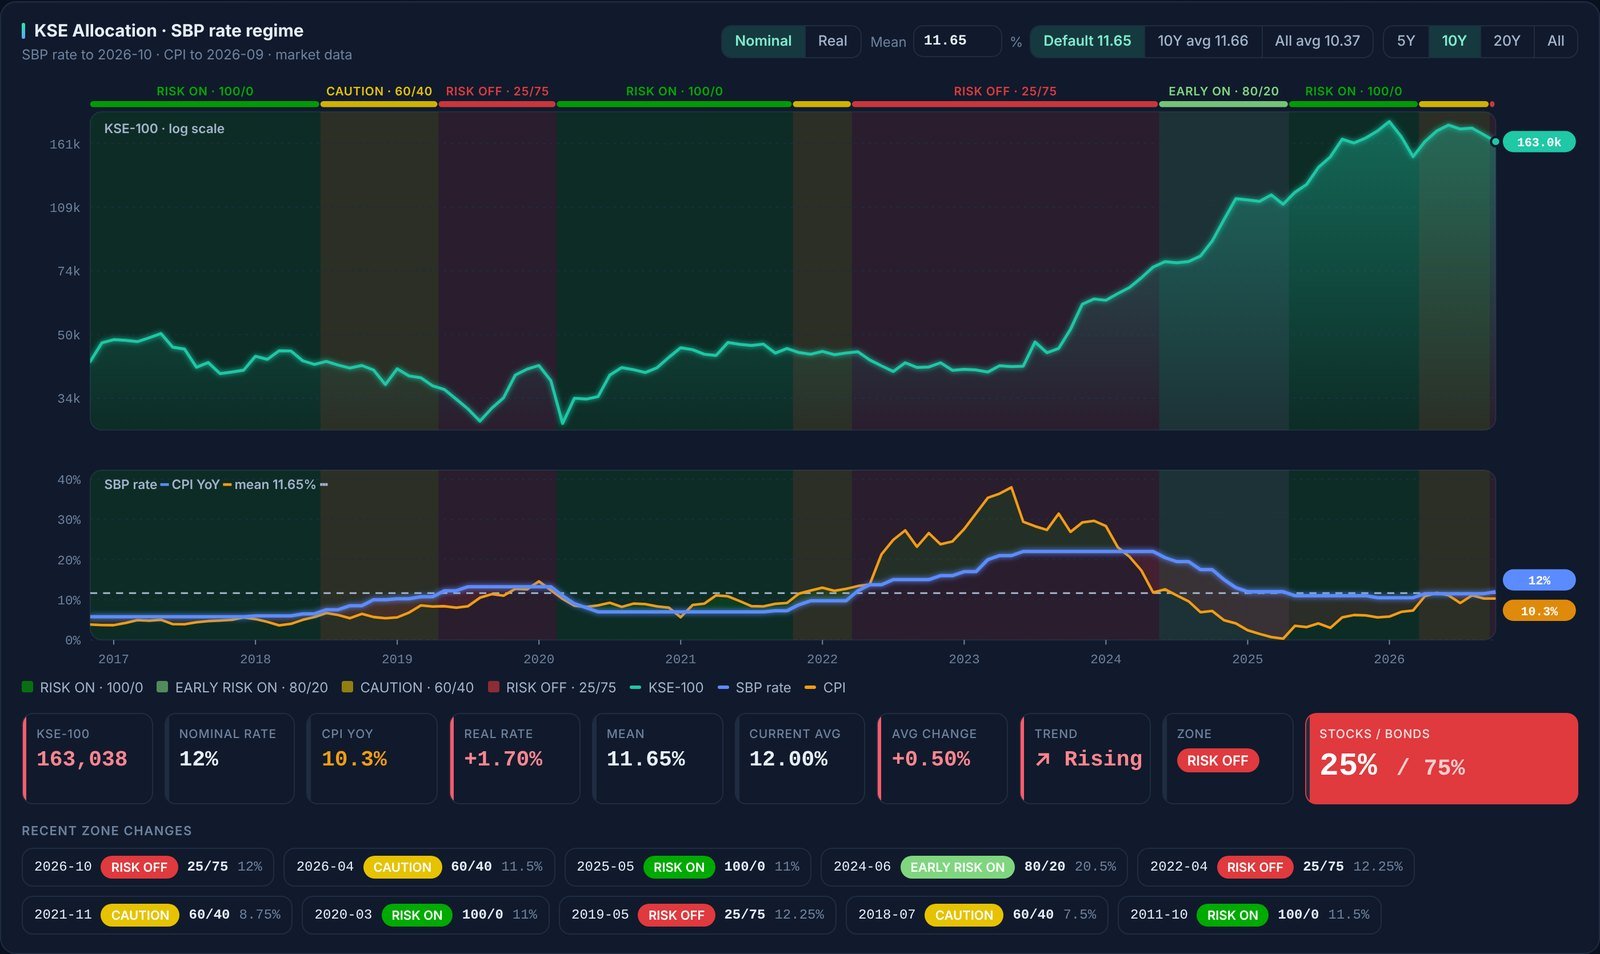
A summary row shows the nominal and real interest rate, the trend in rates, the current zone and a suggested stocks and bonds split. You can switch between nominal and real rates and adjust the long-term rate average that the zones are measured against.
Part 3: PSX stocks
Stock screener with Pulse Score
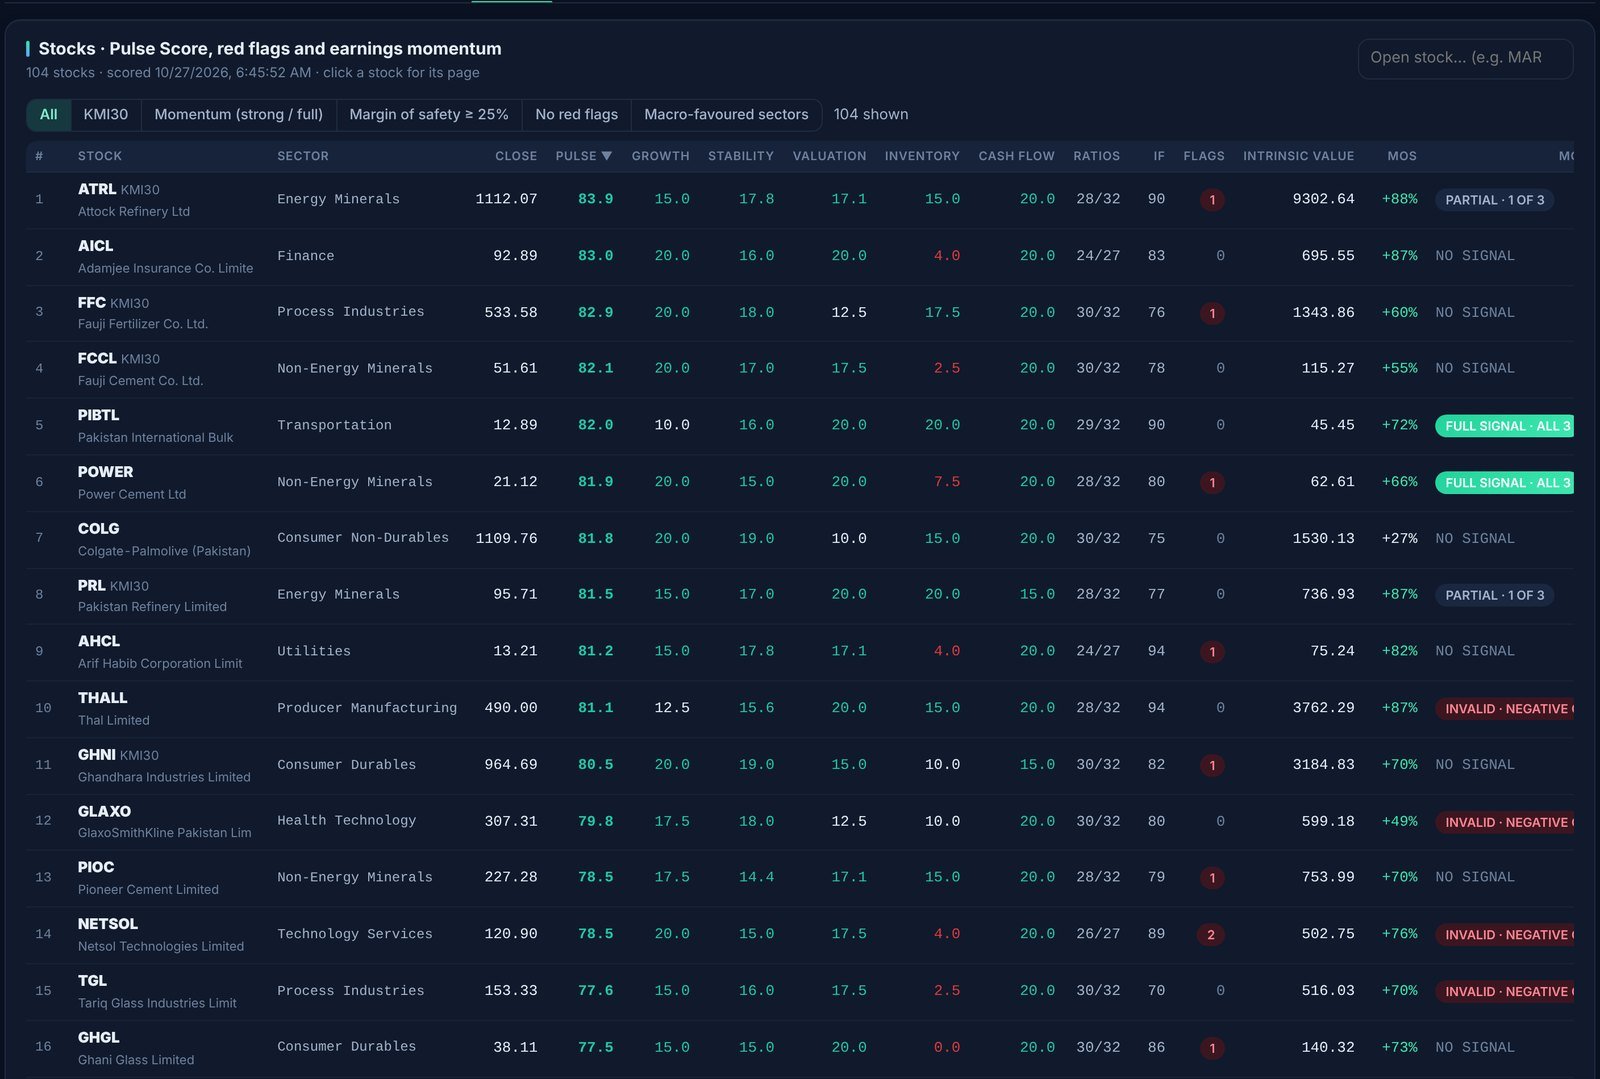
More than 100 PSX-listed companies are scored and ranked. The Pulse Score combines five pillars into a single number, and the table also shows red flags, an intrinsic value estimate, the margin of safety against the current price and an earnings momentum signal.
Company pages
Click any stock to open its company page. Everything you need is on one screen.
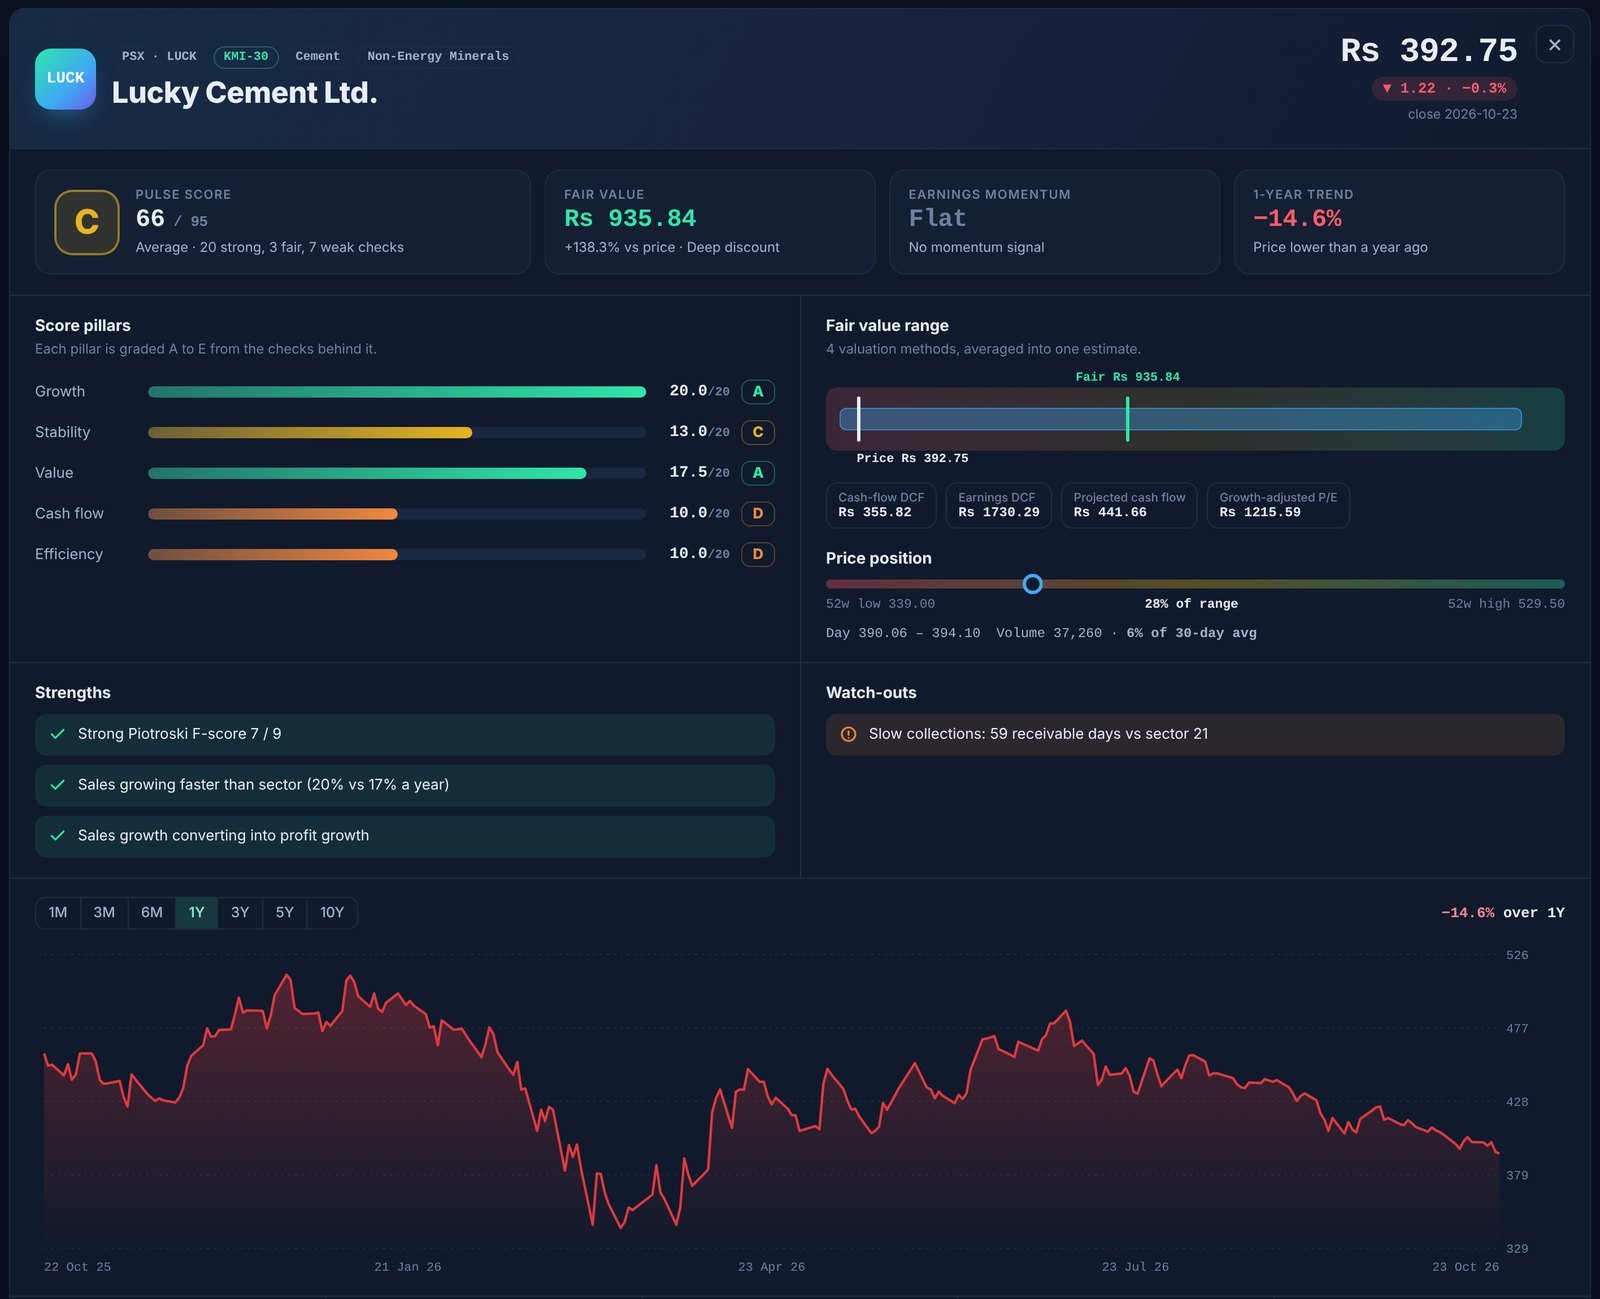
- Four headline verdicts: the Pulse Score with a letter grade, fair value against the current price, earnings momentum and the one-year price trend.
- Score pillars: growth, stability, value, cash flow and efficiency, each graded A to E from the checks behind it.
- Fair value range: four valuation methods (cash-flow and earnings based discounted cash flow, projected cash flow and growth-adjusted P/E) averaged into one estimate, with the current price shown on the same scale.
- Price position within the 52-week range, plus the day’s range and volume.
- Strengths and watch-outs written in plain language, such as sales growing faster than the sector or slow collections from customers.
- A price chart from one month to ten years, followed by a full breakdown of every check behind the score.
Part 4: Seasonality and returns
Markets often show patterns across the calendar year. The Seasonality & Returns page shows how the KSE-100 (and individual stocks) have tended to behave.

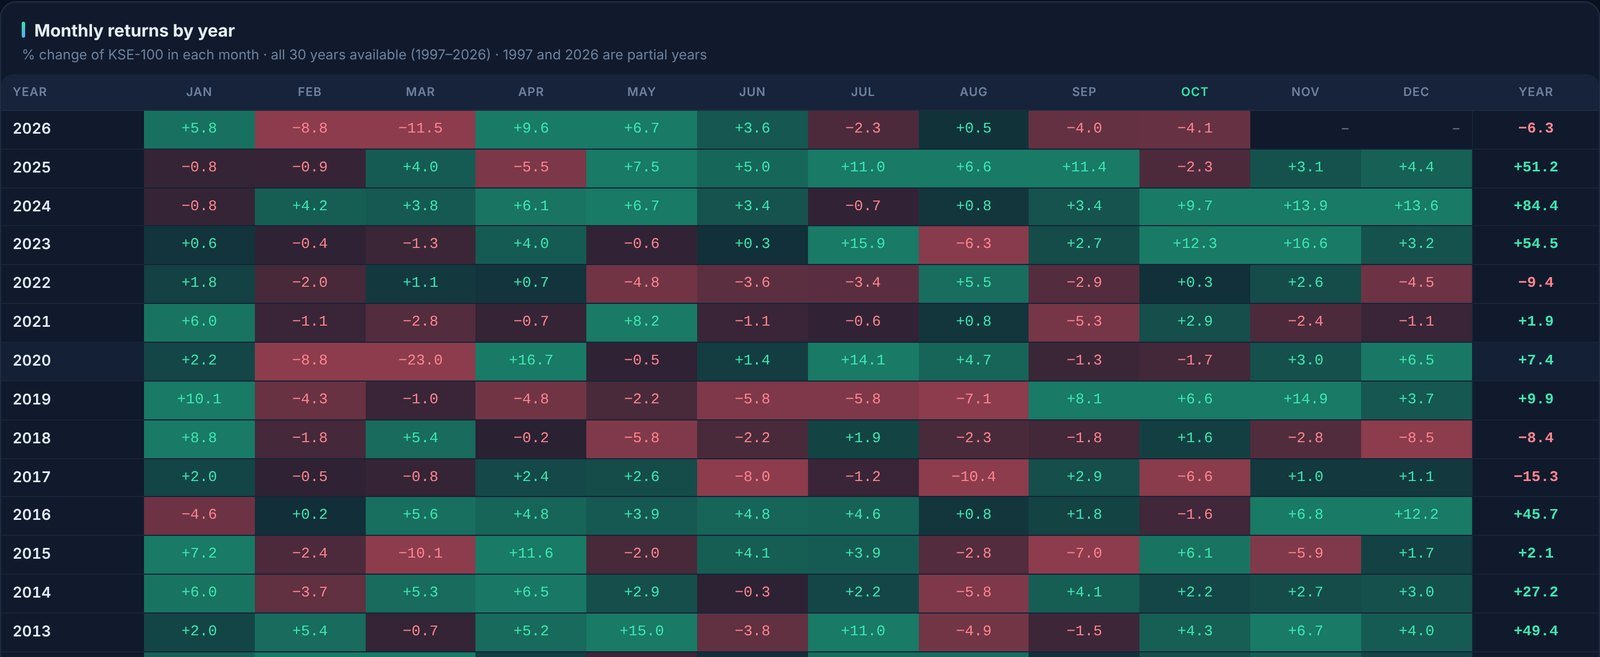
You also get the expected move over the next 1 to 12 weeks based on history, an average yearly price path compared across 5, 10, 20 and all years, and streak probabilities that show what usually happened after runs of up or down months.
Who it is for
- Active traders who follow forex, gold and commodities and want a clear read on positioning.
- PSX investors who want to compare companies on fundamentals and valuation before buying.
- Anyone following Pakistan’s economy who wants a monthly, rules-based view instead of headlines.
Always up to date
Data is refreshed automatically throughout the day. Positioning updates as soon as each weekly report is released, prices and macro data update on their own schedules, and company scores are refreshed as new financial results come in. There is nothing to download and nothing to set up: open the dashboard and the latest numbers are already there.
Try it today
You can explore a free preview of the dashboard right now, no account needed. Full membership will open soon. If you would like to be among the first to know, join the waitlist and we will email you as soon as registration opens.
On this blog we will share regular articles on futures positioning, currencies, Pakistan’s economy and PSX stocks, along with guides on getting the most out of each part of the dashboard. We are glad to have you here.
Bilal, founder of Market Pulse Hub
Screenshots show data as of late October 2026 and are for illustration only.