Cnergyico Pk Limited (PSX: CNERGY), Pakistan’s largest refinery by capacity, released its results for the three months to 30 September 2026 (the first quarter of its 2027 financial year) on 27 October. The headline is striking: a consolidated profit of Rs 12.64 bn, or Rs 2.30 a share, against a loss of Rs 0.78 bn (Rs 0.14 a share) a year earlier.
This post walks through the numbers line by line, explains what drove them, and points out what to keep an eye on. All figures are from the company’s unaudited consolidated statements unless marked standalone.
The results at a glance
| Rs bn, July to September | 2026 | 2025 | Change |
|---|---|---|---|
| Gross revenue | 177.12 | 81.65 | +117% |
| Net revenue (after sales tax and duties) | 145.19 | 61.61 | +136% |
| Gross profit | 22.13 | 0.72 | about 30 times |
| Operating profit | 21.47 | 0.12 | from almost nothing |
| Finance costs | 0.88 | 0.84 | +5% |
| Profit before tax | 20.59 | (0.71) | loss to profit |
| Tax | 7.96 | 0.08 | effective rate 38.6% |
| Profit to shareholders | 12.64 | (0.78) | loss to profit |
| Earnings per share (Rs) | 2.30 | (0.14) |
The standalone company (the refinery itself) earned slightly more, Rs 12.88 bn or Rs 2.34 a share, because the small subsidiaries made a modest loss.
Where the profit came from: margins, not volumes alone
Revenue more than doubled, but the bigger story is the margin. Gross margin jumped to 15.2% of net revenue, from just 1.2% a year ago. For a refinery, a gross margin in the mid teens is unusually high. Refiners normally earn a thin spread between what they pay for crude oil and what they sell fuel for, so a jump like this usually has two sources:
- Better refining spreads. When fuel prices rise faster than crude, every barrel processed earns more.
- Inventory gains. A refinery holds weeks of crude and finished products. When oil prices rise, that stock, bought cheaper, is sold at the new higher price, and the difference lands in gross profit.
Oil prices did rise sharply over the quarter. Brent crude closed June 2026 at about $73 a barrel and September at about $98, a gain of roughly a third. The rupee was steady against the dollar (about Rs 277 to 278), so the rise passed almost fully into local prices. The company’s statements do not split the gross profit between spreads and inventory gains, but with oil up a third in three months, inventory gains are very likely a large part of it.
The pattern: profits that follow oil prices
The last five quarters show how closely Cnergyico’s earnings follow the direction of oil:
| Quarter | Profit to shareholders (Rs bn) | What oil did |
|---|---|---|
| Jul to Sep 2025 | (0.78) | |
| Oct to Dec 2025 | 3.53 | |
| Jan to Mar 2026 | 14.38 | Brent rose to about $104 by March |
| Apr to Jun 2026 | (5.88) | Brent fell from about $104 to $73 |
| Jul to Sep 2026 | 12.64 | Brent rose from about $73 to $98 |
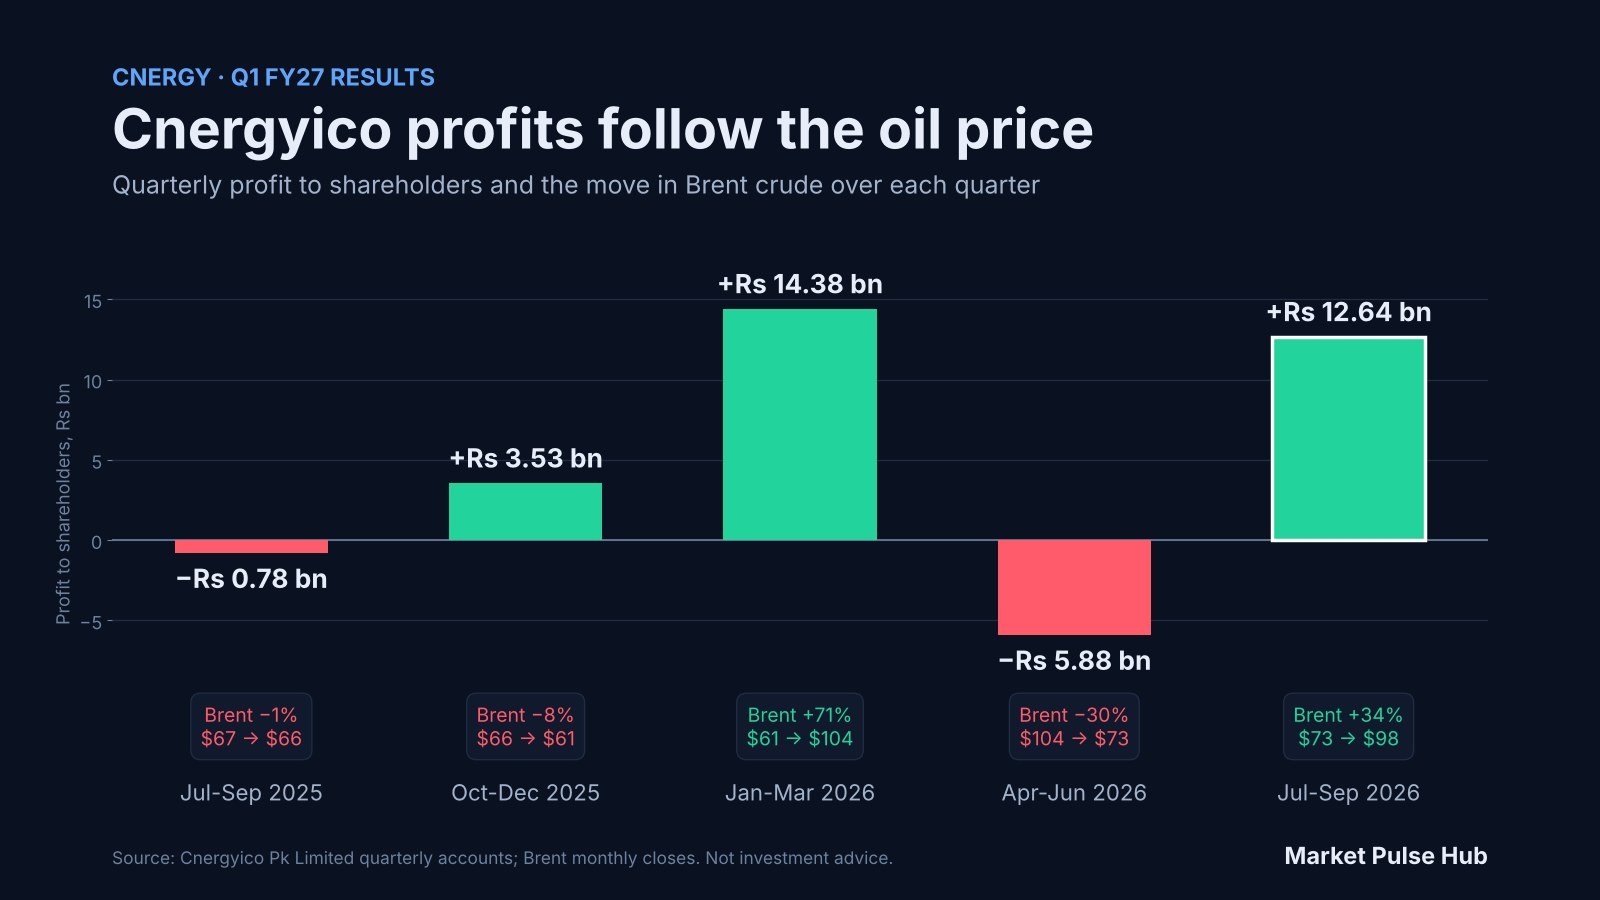
The April to June quarter is the mirror image of this one: when oil fell by about 30%, the company lost Rs 5.9 bn. Quarters with rising oil prices bring large profits and quarters with falling prices bring losses. This is why a single strong quarter should not be multiplied by four.
The balance sheet: inventory doubled
| Rs bn | 30 Sep 2026 | 30 Jun 2026 | Change |
|---|---|---|---|
| Stock in trade (crude and products) | 109.97 | 54.33 | +55.64 |
| Trade and other payables | 143.85 | 102.86 | +40.99 |
| Trade debts (owed by customers) | 38.54 | 36.71 | +1.82 |
| Cash and bank | 3.36 | 3.52 | (0.15) |
| Short-term borrowings | 11.96 | 12.93 | (0.97) |
| Long-term financing, including current portion | 10.38 | 10.66 | (0.29) |
Inventory more than doubled to Rs 110 bn. Part of that is simply the higher oil price raising the value of each barrel held, and part is likely more barrels on hand. Most of the extra stock was financed by suppliers: payables rose by Rs 41 bn. Borrowing actually fell slightly, and total debt of about Rs 22 bn (Rs 19 bn after cash) is small next to quarterly operating profit of Rs 21 bn. Interest cover was a comfortable 24 times.
Cash flow: profit is mostly sitting in inventory
This is the most important caution in the report. Before working capital, operations produced Rs 23.5 bn. But the build-up of inventory absorbed Rs 55.6 bn, only partly offset by the Rs 40.8 bn rise in payables. After interest and Rs 2.6 bn of tax paid, operating cash flow was Rs 3.09 bn, lower than the Rs 5.24 bn of the same quarter last year, when the company made a loss.
- Cash flow covered only about a quarter of reported profit (Rs 3.1 bn against Rs 12.6 bn).
- After Rs 1.83 bn of capital spending, free cash flow was about Rs 1.26 bn.
- Tax payable rose from Rs 4.5 bn to Rs 10.2 bn, so a large tax bill is still to be paid in cash.
Profit tied up in inventory turns into cash only when that stock is sold at today’s prices. If oil falls before then, part of this quarter’s profit reverses, as it did in April to June.
A milestone: accumulated losses almost cleared
Years of losses had left Cnergyico with a large accumulated deficit, and a company generally cannot pay dividends while its accounts carry accumulated losses. This quarter changes that picture:
- At group level, accumulated losses fell from Rs 15.4 bn to Rs 1.95 bn.
- In the standalone accounts, which decide dividend capacity, the balance turned from a loss of Rs 0.82 bn to a positive Rs 12.6 bn.
That does not mean a dividend is coming. The board announced none with these results, cash is thin and the company still owes suppliers heavily. But for the first time in years the accounts no longer rule a payout out.
Valuation snapshot
At the 27 October close of Rs 12.72 (up 3.4% on results day), with 5,493 million shares in issue:
| Measure | Value |
|---|---|
| Market value | about Rs 70 bn |
| Earnings, last four quarters | Rs 24.7 bn, or Rs 4.49 a share |
| Price to earnings, last four quarters | about 2.8 times |
| Book value per share (parent shareholders) | Rs 42.2 (price to book about 0.30) |
| Book value per share excluding the revaluation surplus | Rs 10.9 (price to book about 1.2) |
| Share price, last 52 weeks | low Rs 6.10, high Rs 15.46 |
On these numbers the stock looks very cheap, but two adjustments matter. First, the earnings are swinging with oil prices, so the market is pricing CNERGY on what it expects to earn through a full cycle, not on its best quarters. Second, Rs 172 bn of the book value is a revaluation surplus on the refinery’s assets. It is real accounting equity, but it is an estimate of what the plant is worth, not cash. Without it, the stock trades around 1.2 times book.
What to watch next
- Oil prices. Brent ended October near $110. If it holds or rises, October to December should also benefit from inventory gains. A sharp fall would do the opposite.
- Cash conversion. The next report should show whether the Rs 110 bn of inventory turns into cash and payables come down.
- Tax payments. Rs 10.2 bn of tax is payable, a call on cash in the coming months.
- Dividend policy. With standalone retained earnings now positive, any change in the board’s stance would be a notable signal.
- Refining policy. Margins for Pakistani refiners also depend on government pricing and the refining policy, which can change the picture independently of global oil.
The bottom line
Cnergyico’s quarter was genuinely strong: margins widened, debt stayed low and years of accumulated losses were almost erased. But much of the profit appears to come from rising oil prices lifting the value of the company’s inventory, and most of it is still tied up in that inventory rather than in cash. The recent history of Rs 14 bn profits followed by Rs 6 bn losses is a reminder to judge CNERGY over a full oil cycle, not one quarter.
You can follow CNERGY’s price, Pulse Score and fair value estimate in the Market Pulse Hub dashboard under PSX, Stocks.
Bilal, Market Pulse Hub
Source: Cnergyico Pk Limited, unaudited financial statements for the three months ended 30 September 2026, filed with the Pakistan Stock Exchange on 27 October 2026. Oil prices are monthly Brent closes. This article is for education and information only and is not investment advice.