In Pakistan, few things move the stock market as much as the State Bank of Pakistan’s policy rate. When rates are high and rising, savers can earn double-digit returns from bank deposits, T-bills and income funds without taking any stock market risk, so money drains out of shares. When rates fall, those safe returns shrink, money goes looking for something better, and the stock market usually benefits.
The KSE Allocation tool in Market Pulse Hub turns this relationship into a simple, rules-based guide. Every month it reads the interest rate environment and suggests how much of a portfolio to keep in shares and how much in fixed income. This guide explains, step by step, why the approach works, exactly how the tool makes its decision, how to read every part of the screen, what 26 years of history show and how to fit it into your own investing routine.
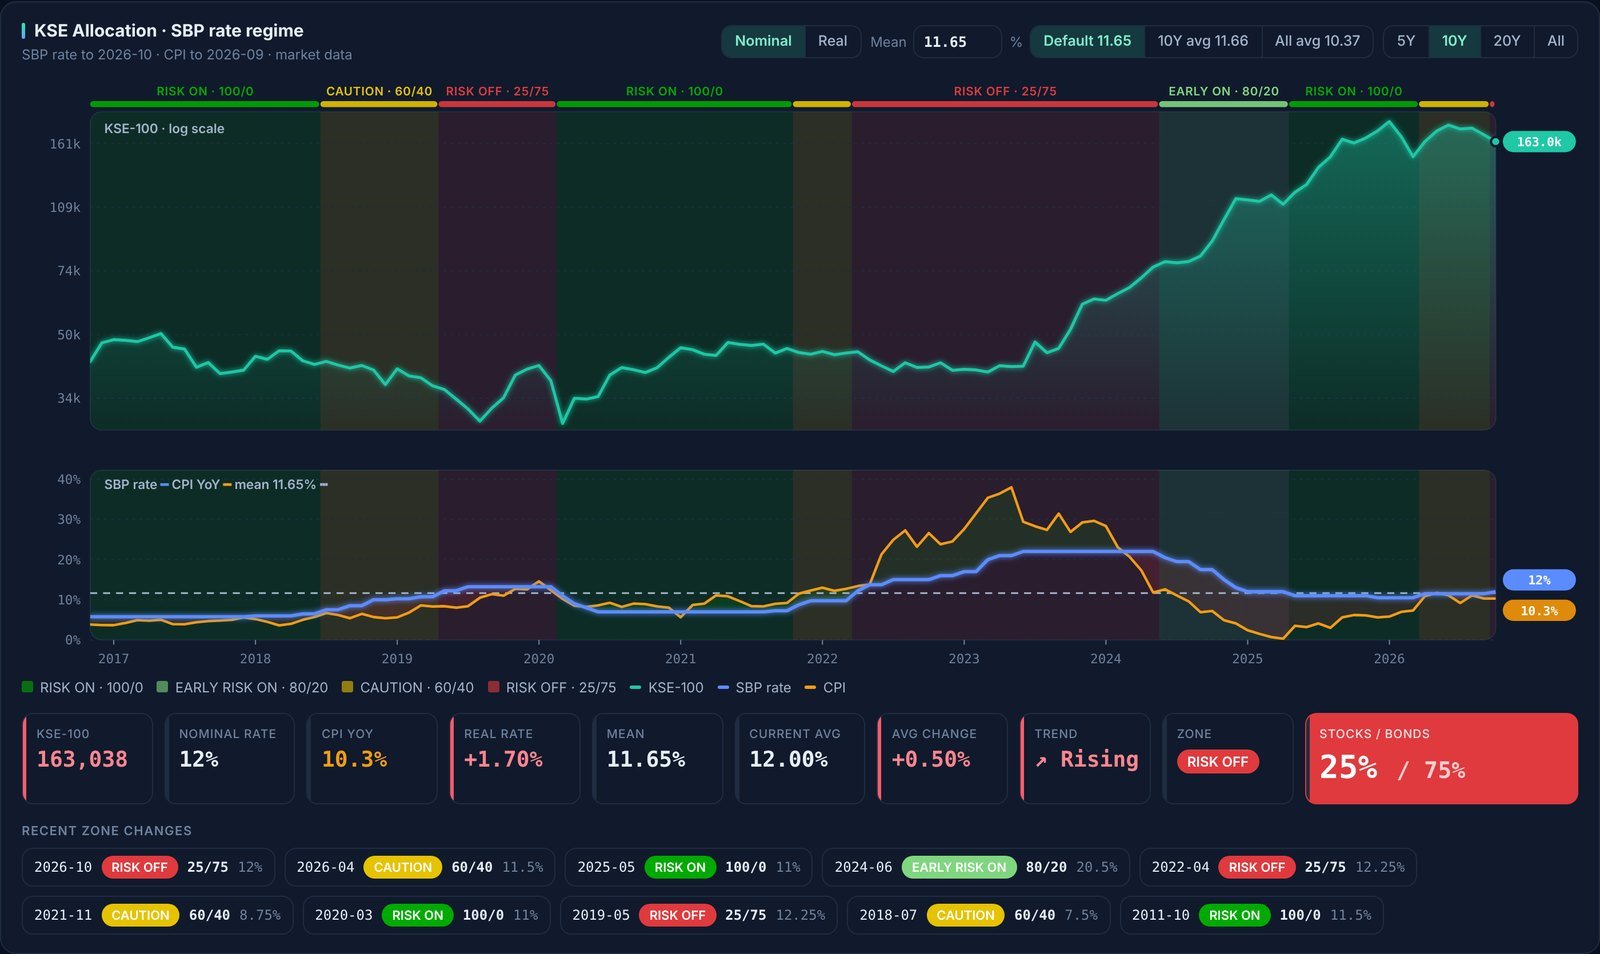
You will find it in the dashboard under PSX / KSE-100, then KSE Allocation.
Why interest rates matter so much for Pakistani stocks
Interest rates affect the stock market through several channels at the same time, which is why the effect is so strong:
- Competition for your money. Every rupee in shares could instead earn the rate on a deposit, a T-bill or a money market fund. When that risk-free return is high, shares have to offer much more to be worth the risk, so prices tend to fall or stall. When it drops, shares look relatively more attractive.
- Company profits. Many Pakistani companies carry significant debt and working capital loans. Higher rates raise their finance costs and squeeze earnings; lower rates do the opposite. Consumers also borrow less for cars and homes when rates are high, which hits sales in sectors such as autos and cement.
- Valuations. Investors value companies by discounting their future profits. A higher discount rate means a lower value today, so price-to-earnings ratios usually shrink when rates rise and expand when they fall.
- Market flows. Large investors such as mutual funds, insurers and banks shift money between equity and fixed income funds as rates change. These shifts can be large enough to move the whole market.
Not every sector reacts the same way. Banks often earn more when rates are high, which is why they can hold up better in tightening cycles, while leveraged and consumer-driven sectors usually suffer most. The KSE Allocation tool looks at the market as a whole; the Leading & Sectors tab, covered at the end of this guide, helps with the sector question.
How the tool makes its decision
Every month the tool asks two questions about the SBP policy rate.
Question 1: Is the rate high or low?
It compares the current policy rate with a long-term average called the mean. By default the mean is 11.65%, close to the average of the last 10 years. A rate above the mean counts as “high”, a rate below it as “low”. You can change the mean yourself, as explained later.
Question 2: Which way is it moving?
The tool compares this month’s rate with last month’s:
- If the rate went up by more than 0.5 percentage points, the trend becomes rising.
- If it went down by more than 0.5 points, the trend becomes falling.
- If it moved by 0.5 points or less, including no change at all, the trend stays as it was.
That last rule is important. The SBP often pauses for a few meetings in the middle of a cycle, and a pause does not mean the cycle is over. Keeping the previous direction stops the tool from flipping back and forth on every hold or small tweak.
The four zones
The two answers combine into four zones, each with a suggested split between stocks and bonds:
| Zone | Rate level | Rate direction | Stocks / Bonds | What it means |
|---|---|---|---|---|
| Risk on | Below the mean | Falling | 100 / 0 | Cheap money that is getting cheaper: the best backdrop for shares. |
| Early risk on | Above the mean | Falling | 80 / 20 | Rates are still high but the easing cycle has started. Markets usually move before rates reach their low. |
| Caution | Below the mean | Rising | 60 / 40 | Rates are low but heading up. The tailwind is fading. |
| Risk off | Above the mean | Rising | 25 / 75 | High and rising rates: fixed income pays well and shares face a strong headwind. |
The direction matters more than the level. That is why “Early risk on” already suggests 80% in shares even though rates are above average, while “Caution” cuts shares to 60% even though rates are below average.
A worked example from 2026
Here is how the rules played out this year:
- March 2026: the policy rate was 10.5%, below the 11.65% mean, and the trend from the 2024 to 2025 cutting cycle was still falling. Zone: Risk on (100/0).
- April 2026: the SBP raised the rate by a full point to 11.5%. That is a rise of more than 0.5 points, so the trend turned rising. The rate was still below the mean, so the zone became Caution (60/40).
- May to September 2026: the rate stayed at 11.5%. No change keeps the previous direction, so the trend stayed rising and the zone stayed Caution.
- October 2026: another 0.5 point rise to 12%. That move on its own is not larger than 0.5, but the trend was already rising, and the rate is now above the mean. Zone: Risk off (25/75).
Reading the screen, step by step
1. The controls

- Nominal / Real: choose whether the zones use the policy rate itself (nominal) or the real rate, which is the policy rate minus inflation. See the section on real rates below.
- Mean: the long-term average the rate is compared with. Type your own value, or use the quick buttons: Default (11.65%), the 10-year average (11.66%) or the average of all data since 2000 (10.37%). Your choice is remembered on your device.
- 5Y, 10Y, 20Y, All: how much history the chart shows. You can also drag across the chart to zoom into any period and click Reset zoom to go back.
2. The chart
The top panel shows the KSE-100 on a log scale. On a log scale, a 10% move looks the same size whether the index is at 5,000 or 160,000, so you can compare old and recent periods fairly. The background of each month is coloured by its zone, and the strip along the top labels each period with its zone and stock/bond split.
The bottom panel shows the SBP policy rate (blue line), inflation (orange line) and the mean (dashed line). Whenever the blue line is above the dashed line, rates count as high; below it, they count as low. The gap between the blue and orange lines is the real rate.
Hover over any month to see its details:
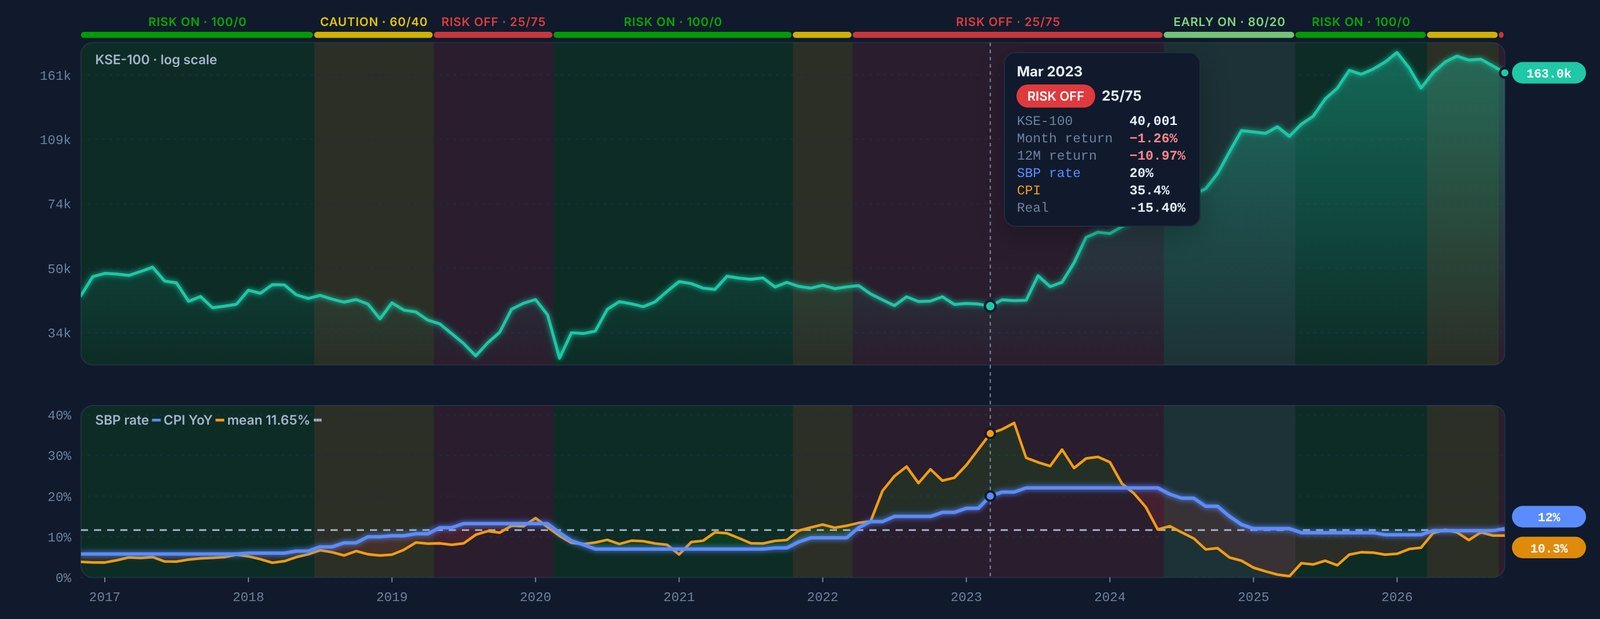
The tooltip lists the zone and split, the KSE-100 level, that month’s return, the 12-month return, the policy rate, inflation and the real rate. It is a quick way to see what the tool was saying at any point in the past, and what happened next.
3. The current reading

From left to right:
- KSE-100: the latest index level, green if it rose from the previous month and red if it fell.
- Nominal rate: the current SBP policy rate.
- CPI YoY: the latest inflation reading.
- Real rate: the policy rate minus inflation. A positive real rate means savers earn more than inflation.
- Mean: the average in use, marked “custom” if you changed it.
- Current avg: the rate value the zone is based on (the policy rate in nominal mode, the real rate in real mode).
- Avg change: how much that value moved since the previous month.
- Trend: rising, falling or stable, decided by the 0.5 point rule.
- Zone and, in the large coloured box, the suggested stocks / bonds split.
At the time of writing (late October 2026), the reading is: policy rate 12%, inflation 10.3%, real rate +1.7%, trend rising, rate above the mean. Zone: Risk off, suggested split 25% stocks and 75% bonds.
4. Recent zone changes

This list shows when the tool last changed its mind. With the default settings there have been 10 zone changes in the last 15 years, fewer than one a year on average. That matters: a strategy that changes rarely keeps trading costs, taxes and stress low.
26 years of rate cycles
The chart goes back to 2000, which covers several full interest rate cycles. Switch to All to see the full history:
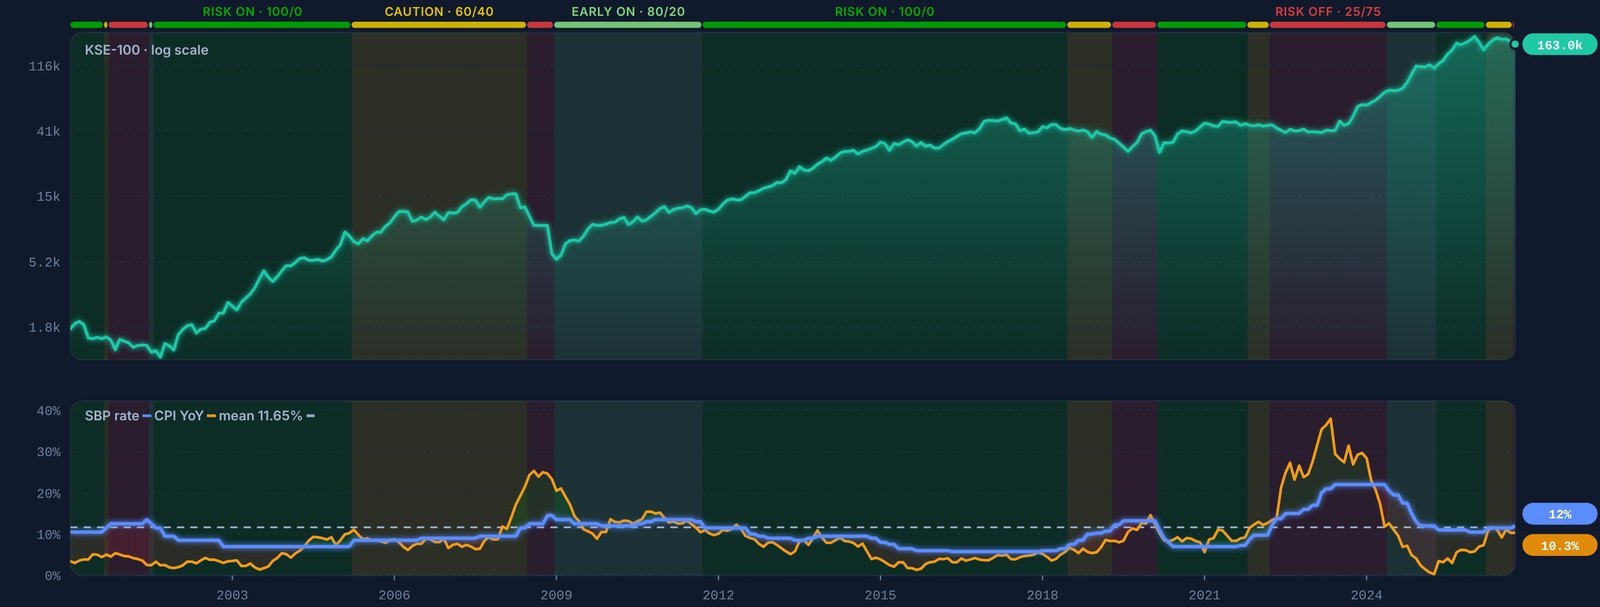
Here are the main periods with the default settings and what the KSE-100 did during each one:
| Period | Zone | Policy rate | KSE-100 during the period |
|---|---|---|---|
| Aug 2001 to Mar 2005 | Risk on | 11.5% down to 7% | +532% |
| Apr 2005 to Jun 2008 | Caution | 8.5% up to 11.5% | +58% |
| Jul 2008 to Dec 2008 | Risk off | 12.5% up to 14.5% | −52% |
| Jan 2009 to Sep 2011 | Early risk on | 13.5% down to 13% | +101% |
| Oct 2011 to Jun 2018 | Risk on | 11.5% down to 6.5% | +256% |
| Jul 2018 to Apr 2019 | Caution | 7.5% up to 10.75% | −12% |
| May 2019 to Feb 2020 | Risk off | 12.25% up to 13.25% | +3% |
| Mar 2020 to Oct 2021 | Risk on | 11% down to 7.25% | +22% |
| Nov 2021 to Mar 2022 | Caution | 8.75% up to 9.75% | −3% |
| Apr 2022 to May 2024 | Risk off | 12.25% up to 22% | +69% |
| Jun 2024 to Apr 2025 | Early risk on | 20.5% down to 12% | +47% |
| May 2025 to Mar 2026 | Risk on | 11% down to 10.5% | +34% |
| Apr 2026 to Sep 2026 | Caution | 11.5% | +14% |
| Oct 2026 | Risk off | 12% | (current) |
Three lessons stand out from this history:
- The big rallies happened in falling-rate zones. The two longest Risk on periods (2001 to 2005 and 2011 to 2018) produced most of the market’s long-term gains.
- Risk off protected investors in real crises. In the second half of 2008 the KSE-100 lost about half its value, and the tool had already moved to 25% stocks.
- It is not perfect at turning points. The 2022 to 2024 Risk off period includes the powerful 2023 to 2024 rally, which started while rates were still at 22% and before the first cut. The tool only moved to Early risk on in June 2024, after the cutting cycle began, so it caught the second half of that rally but not the first.
Zone by zone: what to expect
Using the default settings, we looked at the KSE-100’s return in the month after every reading from 2000 to October 2026:
| Zone | Months | Average KSE-100 return next month | Months the index rose |
|---|---|---|---|
| Risk on | 164 | +2.5% | 65% |
| Early risk on | 45 | +3.0% | 76% |
| Caution | 61 | +0.5% | 52% |
| Risk off | 51 | −0.6% | 51% |
- Risk on has been the most common zone and a consistently good one, with the index rising in about two out of three months.
- Early risk on has been the strongest zone of all. When rates are high but have started to fall, shares are usually cheap and the market is pricing in the cuts still to come.
- Caution has been roughly flat on average. Returns are still possible, but the odds are close to a coin toss.
- Risk off has been the weakest zone on average, with the index slightly negative and some of the deepest falls in history. It also contains sharp rallies near the end of tightening cycles, which is why it never goes to zero in shares.
Putting it into numbers
Here is what the suggested splits mean for a portfolio of Rs 1,000,000:
| Zone | In shares | In fixed income |
|---|---|---|
| Risk on (100/0) | Rs 1,000,000 | Rs 0 |
| Early risk on (80/20) | Rs 800,000 | Rs 200,000 |
| Caution (60/40) | Rs 600,000 | Rs 400,000 |
| Risk off (25/75) | Rs 250,000 | Rs 750,000 |
When the zone changes, the difference is what you would move. For example, the October 2026 change from Caution to Risk off means moving 35% of the portfolio, Rs 350,000 in this example, from shares into fixed income such as T-bills, a money market fund or an income fund.
Many investors do not move it all at once. A common approach is to shift half immediately and the rest over the following two or three months, which reduces the risk of acting on a signal that reverses quickly.
Choosing the mean
The mean decides what counts as a “high” or “low” rate, so it shapes which zone you are in. The three presets give similar results today:
- Default (11.65%) and 10-year average (11.66%): 10 zone changes in the last 15 years. Current zone: Risk off.
- All-data average (10.37%): 9 zone changes in the last 15 years. Current zone: Risk off.
A lower mean makes the tool treat more rate levels as “high”, so it spends more time in Early risk on and Risk off. A higher mean does the opposite. If you believe Pakistan’s “normal” policy rate has changed, for example because inflation is expected to stay lower than in the past, you can set your own mean and immediately see how the history and the current zone change.
Nominal or real rates?
The nominal view uses the policy rate as announced. It is simple, changes only after SBP decisions and is the default.
The real view subtracts inflation from the policy rate. This often gives a truer picture of how tight money is: a 20% policy rate with 35% inflation, as in early 2023, was actually a real rate of about −15%, very loose in real terms. In real mode the mean defaults to +0.5%.
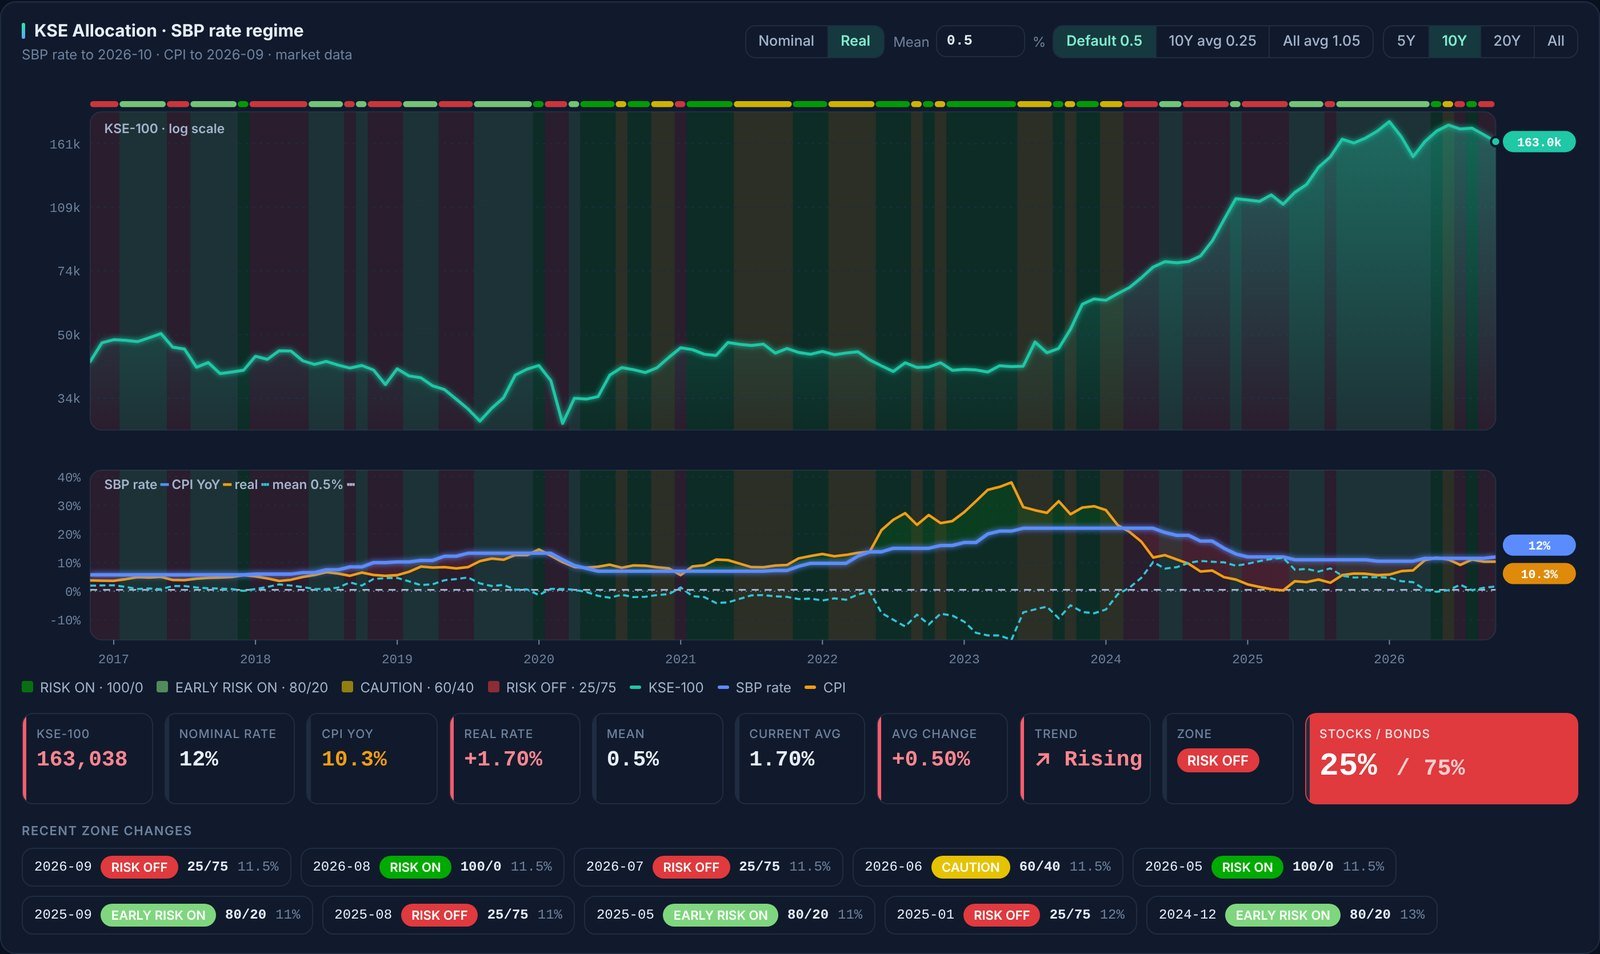
The drawback is noise. Inflation changes every month and can swing sharply, so the real view changes zone far more often: 76 times in the last 15 years compared with 10 for the nominal view. For that reason we suggest using the nominal view as your main guide and the real view as a second opinion. When both agree, the signal is stronger. Today both read Risk off.
How it would have performed
To test the idea, we ran a simple hypothetical strategy: each month, hold the suggested split, with the share part in the KSE-100 and the fixed income part earning the policy rate. Compared with simply holding the KSE-100:
| Period | Strategy, per year | KSE-100, per year | Worst fall: strategy | Worst fall: KSE-100 |
|---|---|---|---|---|
| Since 2000 | 22.8% | 18.4% | −28% | −64% |
| Last 10 years | 17.9% | 15.1% | −23% | −42% |
| Last 5 years | 25.8% | 28.7% | −19% | −19% |
Over the long run the approach earned more than the index while cutting the worst fall by more than half. Over the last five years it trailed, because it spent much of the 2023 to 2024 rally in Risk off. That is the trade-off: the tool aims to avoid the worst periods, and in exchange it sometimes misses the start of a recovery.
These results are hypothetical and use monthly data. They ignore trading costs, taxes and the difference between the policy rate and what you can actually earn on bonds, deposits or funds. Past performance does not guarantee future results.
Limitations to keep in mind
- It follows rates, it does not predict them. The zone changes after the SBP acts, so markets that move ahead of rate decisions can turn before the tool does.
- It is one factor. Interest rates are the single most important driver of the Pakistani market, but politics, the IMF programme, commodity prices, foreign flows and company earnings all matter too.
- It is about the whole market. It says nothing about which stocks or sectors to own. Some sectors, such as banks, can do well even in Risk off.
- Monthly data. The tool works on monthly readings, so it will not react to events within a month.
- Your returns will differ. Real fixed income returns, fund fees, taxes and timing all affect what you actually earn.
A simple monthly routine
- After each SBP monetary policy decision, open KSE Allocation and check the zone and split.
- Compare with your current mix. If your share allocation is far from the suggested split, decide how much to move, and consider moving it in stages.
- Check the real view. If nominal and real agree, act with more confidence; if they disagree, move more gradually.
- Check the Pakistan Economy tab. It shows whether inflation, the current account and reserves support further cuts or more hikes, which hints at where the zone may go next.
- Use the Leading & Sectors tab and the Stocks tab to decide what to hold within your share allocation. In defensive zones, the sector tilt favours defensive sectors, and the Pulse Score helps you pick quality companies.
Frequently asked questions
How often does the zone change?
Rarely. With the default settings, about 10 times in 15 years. In most months nothing changes.
When is the tool updated?
The policy rate, inflation and KSE-100 data are refreshed automatically. A new zone can appear after an SBP rate decision or when a new month’s data arrives.
Why does Risk off still hold 25% in shares?
Because rate cycles end and markets often rally hard near the end of tightening. Keeping a quarter in shares means you still take part when that happens.
Can I use it for individual stocks?
It is designed for the overall split between shares and fixed income. Individual stocks depend much more on their own earnings and valuation, which the Stocks tab covers.
Which setting should I use?
For most investors, the defaults: nominal view with the 11.65% mean. Experienced users can adjust the mean to match their own view of where rates will settle.
Try it yourself
The KSE Allocation tool is part of the Market Pulse Hub dashboard. Explore the free preview today, and join the waitlist to hear first when full membership opens.
Bilal, Market Pulse Hub
Screenshots and figures show data as of late October 2026. This article is for education only and is not investment advice.