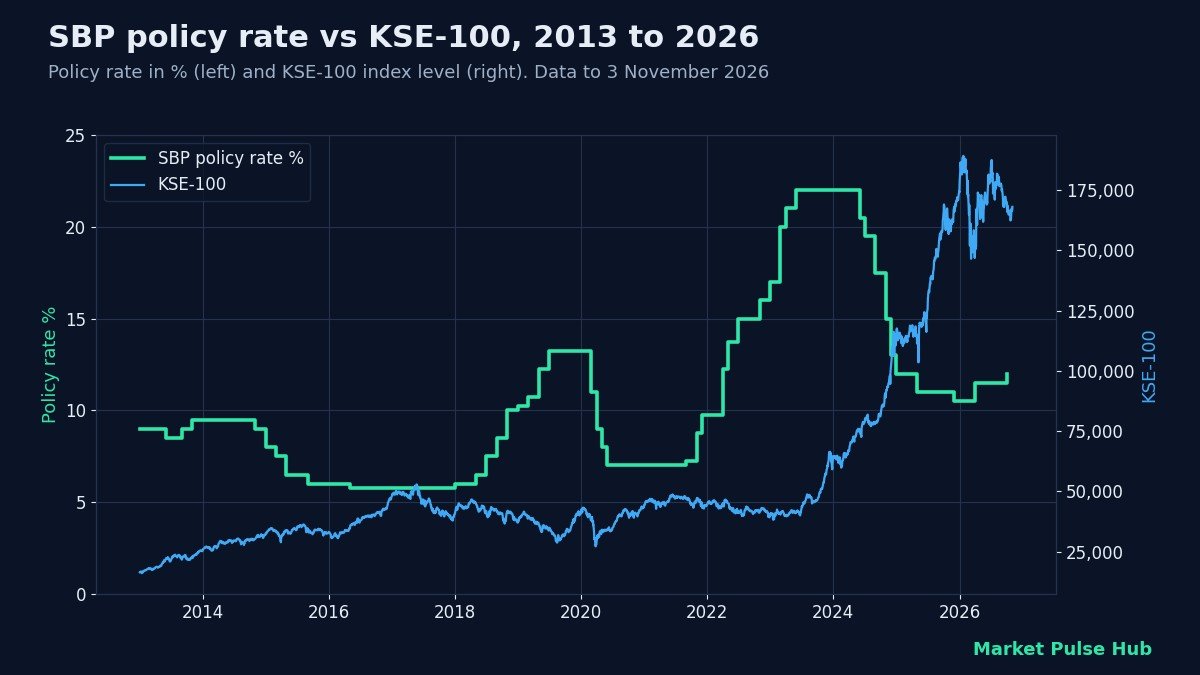
SBP interest rate stocks questions come up every time the State Bank of Pakistan’s Monetary Policy Committee meets: will a cut push the KSE-100 higher, and will a rise hurt it? This guide uses the policy rate history and KSE-100 prices from 2013 to 3 November 2026 to show what has actually happened around rate changes, why rates matter for share prices, and which PSX sectors are most sensitive.
Where the policy rate stands now
According to the State Bank of Pakistan, the Monetary Policy Committee raised the policy rate by 50 basis points to 12% with effect from 27 October 2026. It was the second increase in 2026 in our data, after the rate moved up from 10.5% to 11.5% by April 2026. Consumer price inflation was 9.6% year on year in October 2026, so the policy rate was about 2.4 percentage points above inflation. The 10-year government bond yield at the auction of 7 October 2026 was 12.85%.
On 3 November 2026 the KSE-100 closed at 168,019.
Why the SBP interest rate matters for stocks
- Competing returns: when Treasury bills, bank deposits and money market funds pay more, some savers move money out of shares. When rates fall, the reverse happens.
- Valuations: investors value a company’s future profits by discounting them. A higher interest rate means a higher discount rate and a lower value today, so P/E ratios tend to shrink when rates rise.
- Company borrowing costs: companies with large loans pay more interest when rates go up, which cuts their profit after tax. Lower rates do the opposite.
- Demand in the economy: cheaper credit supports car sales, construction and consumer spending, which helps autos, cement and steel.
- Banks: banks often earn wider margins when rates are high, so bank profits can move in the opposite direction to the rest of the market. See our bank stocks comparison.
SBP interest rate cycles and the KSE-100 since 2013
The table below takes each period of rate cuts or rate rises in our policy rate data and compares the KSE-100 at the month-end before the first change with its level at the month of the last change. Our rate series is monthly, so dates are shown to the month.
| Cycle | Rate changes | Policy rate | KSE-100 before first change | KSE-100 at last change | KSE-100 change | KSE-100 12 months after first change |
|---|---|---|---|---|---|---|
| Cutting | November 2014 to May 2016 | 9.5% to 5.75% | 30,377 | 36,062 | +18.7% | +12.8% |
| Raising | January 2018 to July 2019 | 5.75% to 13.25% | 40,471 | 31,938 | -21.1% | -8.4% |
| Cutting | March 2020 to June 2020 | 13.25% to 7% | 37,984 | 34,422 | -9.4% | +20.7% |
| Raising | September 2021 to June 2023 | 7% to 22% | 47,420 | 41,453 | -12.6% | -10.7% |
| Cutting | June 2024 to December 2025 | 22% to 10.5% | 75,878 | 174,054 | +129.4% | +57.7% |
| Raising | April 2026 to October 2026 | 10.5% to 12% | 148,743 | 166,409 | +11.9% | not yet |
Three patterns stand out, along with some exceptions. First, the two big cutting cycles of 2014 to 2016 and 2024 to 2025 both came with strong gains: 19% and 129% respectively. Second, the long rate-raising cycles of 2018 to 2019 and 2021 to 2023 both saw the index fall, by 21% and 13%. Third, timing matters: the sharp cuts of March to June 2020 came during the COVID-19 sell-off, and the index fell over those four months before rising 21% in the 12 months after the first cut. The current rate-raising cycle that began in 2026 has also been an exception so far, with the index up 12% between the end of March and the end of October 2026.
The market also tends to move before the central bank. After the rate reached 22% in mid-2023 and was held there, the KSE-100 rose about 83% between the end of June 2023 and the end of May 2024, before the first cut was made. Investors were already pricing in lower rates.
How the index moved in rate-change months
Looking month by month, using each month’s policy rate in our data and the KSE-100’s month-end close, gives a simpler picture.
| Month type | Number of months | Average KSE-100 change | Median change | Share of months the index rose |
|---|---|---|---|---|
| Months with a rate cut | 19 | +1.59% | +2.70% | 58% |
| Months with a rate rise | 24 | +0.17% | -1.16% | 42% |
| Months with no change | 122 | +1.83% | +1.92% | 61% |
Months with a rate cut saw a median rise of 2.7%, while months with a rate rise saw a median fall of 1.2%. The index rose in 58% of cut months but only 42% of rise months. These are small samples, and many other things moved the market in the same months, so treat them as a tendency rather than a rule.
Which PSX sectors are most rate sensitive
The sectors that benefit most from lower rates are usually those carrying the most debt, because every cut reduces their finance costs. The table shows the median debt to equity ratio by sector in our data (banks excluded), with the five most indebted and four least indebted sectors that have at least four companies.
| Sector | Companies in our data | Median debt / equity | Companies with debt above equity |
|---|---|---|---|
| Sugar and Allied Industries | 9 | 1.39x | 6 |
| Textile Spinning | 7 | 1.04x | 4 |
| Oil and Gas Marketing Companies | 6 | 0.96x | 3 |
| Textile Composite | 16 | 0.95x | 8 |
| Miscellaneous | 6 | 0.78x | 2 |
| Pharmaceuticals | 12 | 0.17x | 0 |
| Refinery | 4 | 0.16x | 0 |
| Automobile Assembler | 7 | 0.02x | 1 |
| Insurance | 9 | 0.02x | 0 |
Sugar, textile and oil marketing companies carry the most debt relative to equity, so a change in rates has a bigger effect on their profit after tax. Insurance companies, car assemblers and refineries have little debt, so their earnings depend more on other factors. For a closer look at one rate-sensitive sector, see our cement stocks comparison.
Banks work differently. Their profits come from the gap between what they earn on loans and investments and what they pay depositors, so the 20 banks in our data often report higher profits when rates are high and come under pressure when rates fall quickly.
How to use this as an investor
Rate decisions are only one input. Inflation, the current account, oil prices, foreign flows and company results all matter as much. A few practical points:
- Watch the gap between the policy rate and inflation (the real rate). A large positive gap gives the SBP room to cut later.
- Look at the debt levels of companies you own, not just the sector average.
- Remember the market often moves on expected rate changes before they happen.
- Our KSE Allocation guide explains how the dashboard uses interest rates to suggest a stocks and bonds mix.
Frequently asked questions
What is the SBP policy rate now?
The State Bank of Pakistan set the policy rate at 12% with effect from 27 October 2026, after a 50 basis point increase. Check the SBP website for any later decision.
Do PSX stocks always rise when interest rates are cut?
No. In our data the KSE-100 rose in 58% of months with a rate cut. In 2020 the index fell during the cutting cycle amid the COVID-19 sell-off, although it recovered strongly over the following year.
Which stocks benefit from interest rate cuts in Pakistan?
Companies with high debt usually benefit most, because their finance costs fall. In our data the most indebted sectors by median debt to equity were sugar, textile spinning and oil marketing. Lower rates can also support demand for cars, cement and consumer goods.
Why do bank stocks sometimes fall when rates are cut?
Banks earn a margin between lending and deposit rates. When rates fall quickly, the yield on their loans and government securities can drop faster than their deposit costs, which squeezes profit.
Where can I follow SBP interest rate decisions?
Each decision of the Monetary Policy Committee is announced by the State Bank of Pakistan and posted on its website, which also shows the current policy rate. In our data the rate changed in 43 of the 165 months covered since early 2013.
Use the free Market Pulse Hub dashboard to check any of these stocks yourself, and join the waitlist to get new tools and reports first.
Bilal, Market Pulse Hub
Figures are from company results, exchange data and our calculations up to 3 November 2026 and will change as new data arrives. This article is for education only and is not investment advice.