The Stocks section of the Market Pulse Hub dashboard scores every company we follow on the Pakistan Stock Exchange, estimates a fair value for it, checks its accounts for warning signs and tracks whether its profits are accelerating. This guide walks through each part of it with screenshots, using National Refinery (NRL) as the worked example, so you can read any stock page with confidence.
The figures in the screenshots are from 31 October 2026. They change as new prices and results arrive, so the numbers you see on the dashboard today will differ.
How to open it
On the dashboard, choose PSX / KSE-100, then the Stocks tab. The first sub-tab, also called Stocks, is the ranked list. The other sub-tabs are the Screener, Sectors, Compare, and Upgrades & downgrades. You can also open a stock directly with a link such as marketpulse-hub.com/?stock=NRL.
1. The stock list
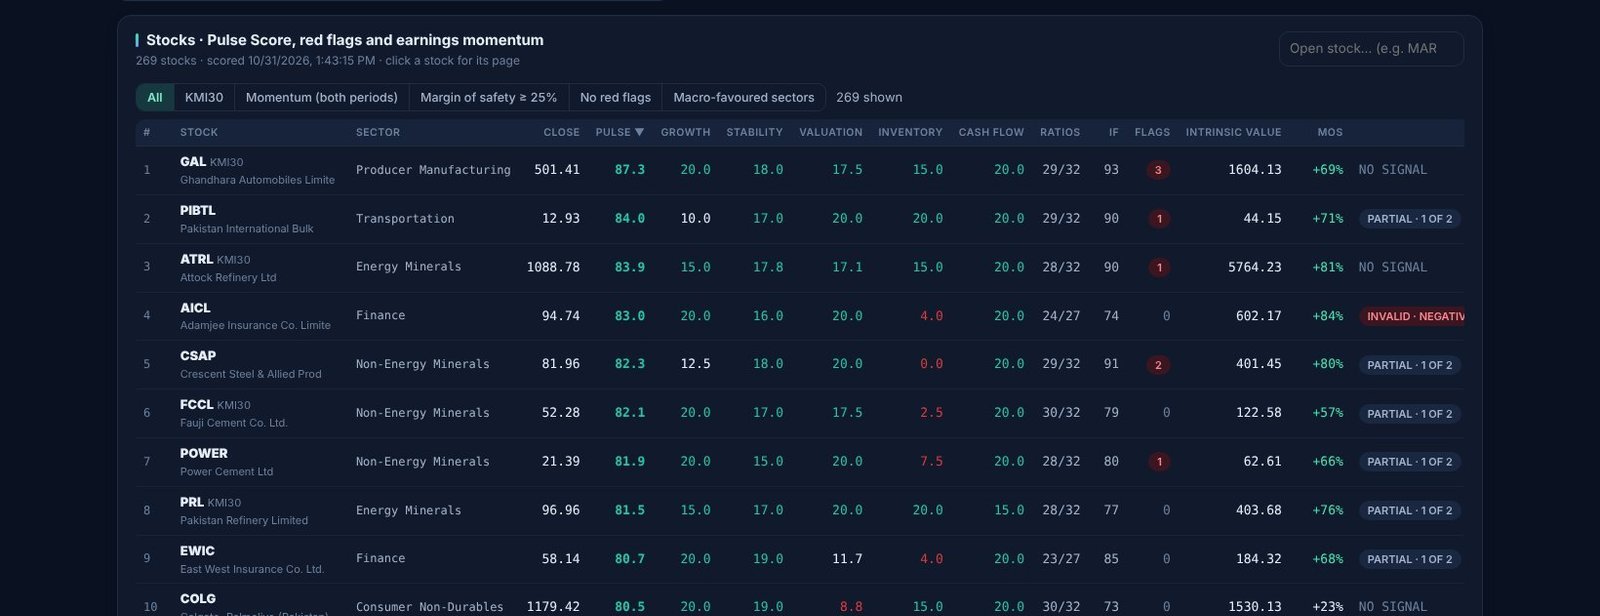
Each row is one company. The line under the heading tells you how many stocks are scored and when the scores were last calculated. Here is what each column means:
| Column | What it shows |
|---|---|
| Stock | The PSX symbol and company name. A KMI30 tag marks members of the KMI-30 Shariah index. |
| Sector | The industry group used to compare the company with its peers. |
| Close | The last closing price in rupees. |
| Pulse | The overall Pulse Score, out of 95. Roughly: 70 or more is good, 50 to 70 is average, under 50 is weak. The list is sorted by this column by default. |
| Growth, Stability, Valuation, Inventory, Cash flow | The five pillar scores, each out of 20. Green is strong, amber middling, red weak. |
| Ratios | How many of the model’s ratios had data for this company, for example 29/32. A low count means the score rests on fewer facts. |
| IF | The classic score from a 32-ratio checklist, shown for comparison with the Pulse Score. |
| Flags | The number of red flags found in the accounts. Zero is best. Hover over the number for details. |
| Intrinsic value | Our estimate of what one share is worth, in rupees. |
| MoS | Margin of safety: how far the price is below the intrinsic value. +50% means the price is half of the estimate. A negative figure means the price is above it. |
| Momentum | The earnings momentum verdict: Full signal (both periods), Partial (1 of 2), No signal, or Invalid when growth is negative. |
| TTM ratio, Q YoY ratio | Profit growth divided by operating profit growth, over the last 12 months and over the latest quarter against a year earlier. Explained in section 12. |
Click any column heading to sort by it. Click a row to open that stock’s page. The box at the top right opens a stock by symbol.
Quick filters
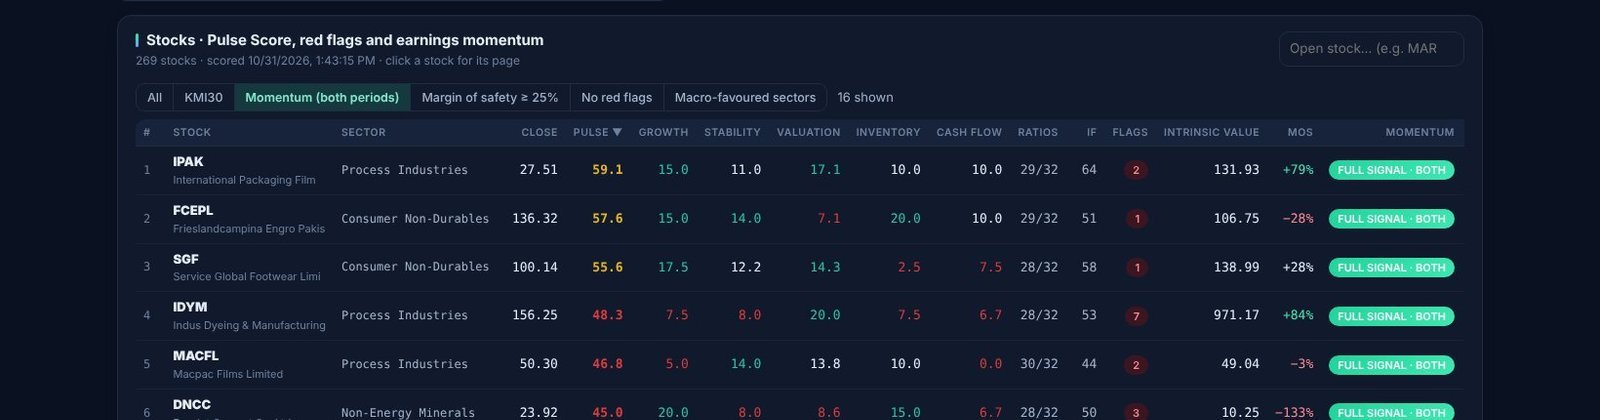
The buttons above the table narrow the list in one click:
- All shows every scored stock.
- KMI30 shows only Shariah-compliant KMI-30 members.
- Momentum (both periods) shows companies with a full earnings momentum signal.
- Margin of safety ≥ 25% shows stocks priced at least 25% below our fair value estimate.
- No red flags hides any company with a warning sign in its accounts.
- Macro-favoured sectors keeps the sectors favoured by the current economic regime (growth and inflation) and the KSE-100 risk zone, as shown in the Leading & Sectors tab.
The count at the end of the row, for example “16 shown”, tells you how many stocks pass. For combining several conditions of your own, use the Screener.
2. The top of a stock page
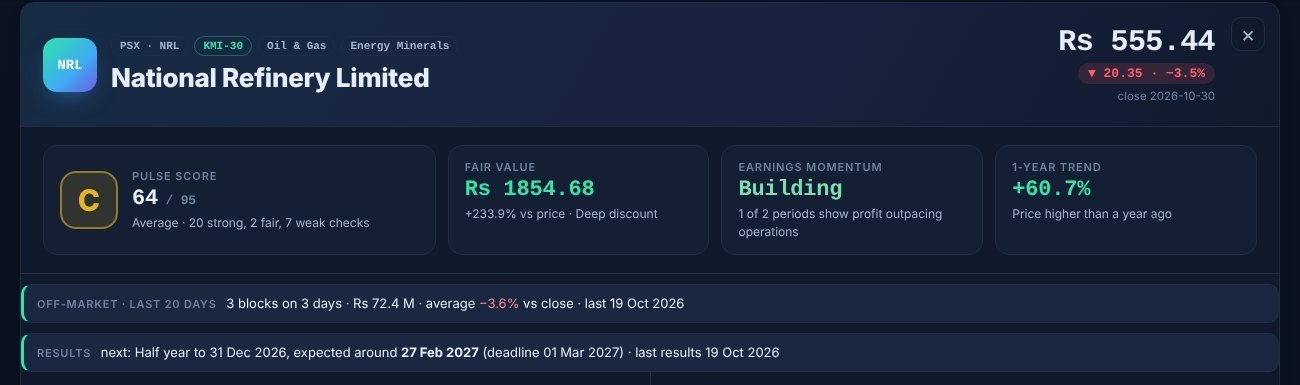
The header shows the company name, symbol, KMI-30 membership, sector, the last close and the day’s change. Below it are four cards that sum up the stock:
- Pulse Score: the overall score out of 95 with a letter grade (A is best, E is weakest) and how many checks came out strong, fair and weak. NRL scores 64 / 95, grade C, with 20 strong, 2 fair and 7 weak checks.
- Fair value: our estimate per share and how far it is above or below the price. Labels run from Deep discount (30% or more upside) through Below fair value and Near fair value to Above fair value. NRL shows Rs 1,854.68 against a price of Rs 555.44, marked Deep discount.
- Earnings momentum: Accelerating when both periods pass, Building when one of the two passes (as for NRL), Flat when neither does.
- 1-year trend: the price change over the last year. NRL is up 60.7%.
Two strips follow. Off-market lists block deals over the last 20 trading days: how many, their value and their average price against the close. Large blocks at a premium can mean informed buying; at a discount, the opposite. Results shows when the next results are expected, the legal deadline, and when the last results came out.
3. Score pillars, fair value range and price position
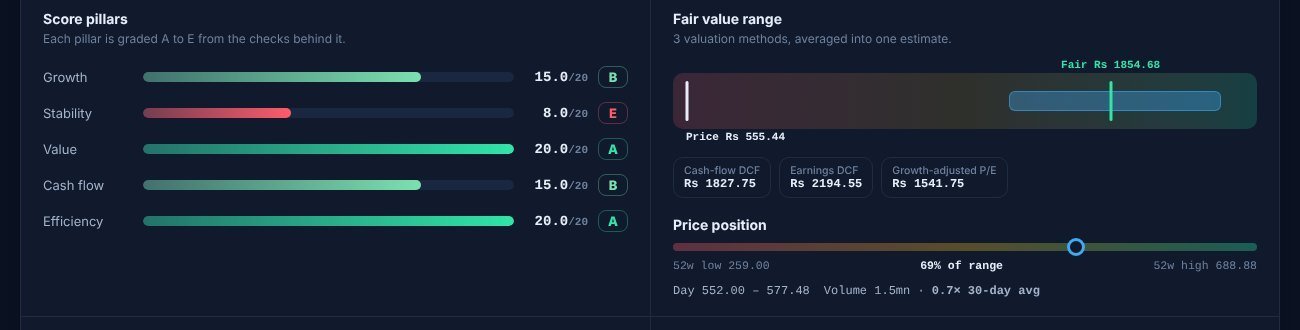
Score pillars break the Pulse Score into its five parts, each out of 20 and graded A to E:
- Growth: five-year growth in sales, operating profit, net profit and earnings per share.
- Stability: margins, debt, interest cover, liquidity, how well profit is backed by cash, and return on equity. This pillar carries the most weight in the score.
- Value: price against earnings, book value, sales and dividends, and earnings yield against the T-bill rate.
- Cash flow: free cash flow and the cash return on the capital invested.
- Efficiency: inventory turnover, how quickly customers pay, and the cash cycle, compared with the sector.
Read the pillars together. NRL is strong on value, efficiency, growth and cash flow but weak on stability (8 out of 20, grade E), mainly because its margins are thin, as is normal for a refinery. A high total with one very weak pillar deserves a closer look at that pillar.
Fair value range shows the valuation methods averaged into the estimate. There are up to four: a cash-flow DCF and an earnings DCF (future free cash flow or earnings discounted to today), projected cash flow, and growth-adjusted P/E (the Peter Lynch method). A method that cannot be calculated, or comes out negative, is left out; NRL uses three. The coloured band shows the range between them and the marker shows the price. When the methods disagree widely, as they can for a company with uneven cash flow, treat the estimate with more caution.
Price position places the price in its 52-week range. NRL is at 69% of its range: closer to the high than the low. Below the bar are the day’s range and the volume against the 30-day average; volume well above average shows unusual interest.
4. Strengths and watch-outs

These lists turn the checks into sentences. Strengths include a high Piotroski F-score (nine checks on profitability, debt and efficiency; 9 out of 9 for NRL), sales growing faster than the sector, and operating cash flow at or above net profit.
Watch-outs include red flags from the accounts, such as high accruals (profit not backed by cash), slow collections from customers compared with the sector, or profit rising much faster than operating profit, which can point to one-off income or a lower tax charge. “Nothing notable” means no warning was triggered. A watch-out is a reason to read the company’s report, not a verdict on its own.
5. Dividends
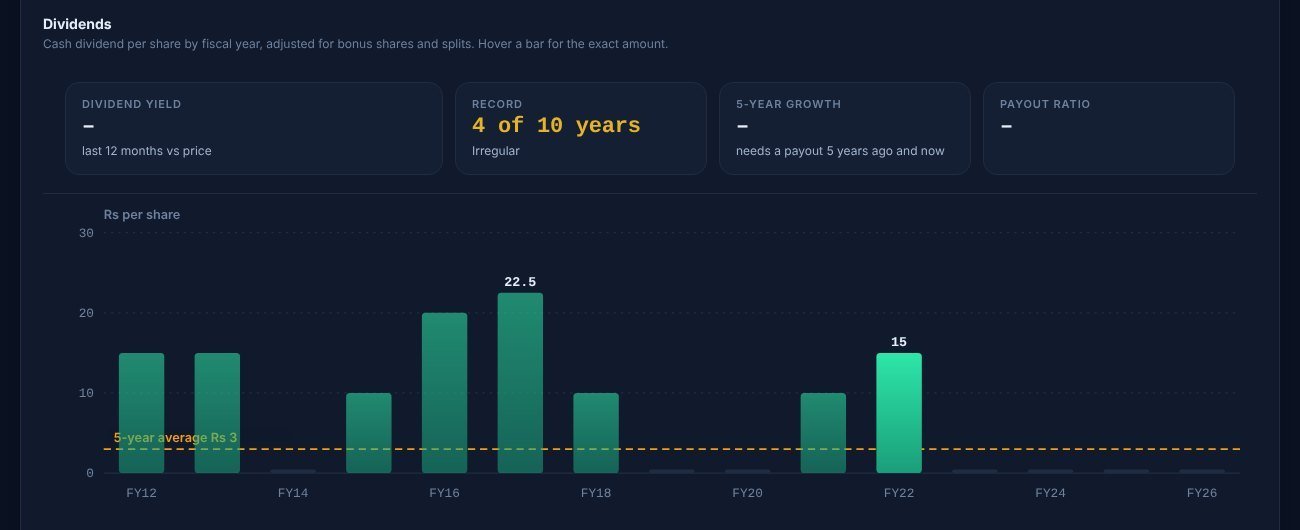
The four figures at the top are:
- Dividend yield: cash dividends paid in the last 12 months as a percentage of the price.
- Record: in how many of the last 10 years a cash dividend was paid. NRL paid in 4 of 10, marked Irregular; 10 of 10 is marked Very consistent.
- 5-year growth: the yearly growth rate of the dividend per share. It needs a payout both five years ago and now.
- Payout ratio: the share of profit paid out as dividends.
The bars show the dividend per share for each fiscal year, and the dashed line marks the five-year average. Hover over a bar for the exact amount. Below the chart you will find the latest payout announcement and its ex-date, when the company has one.
6. Price chart and fair value
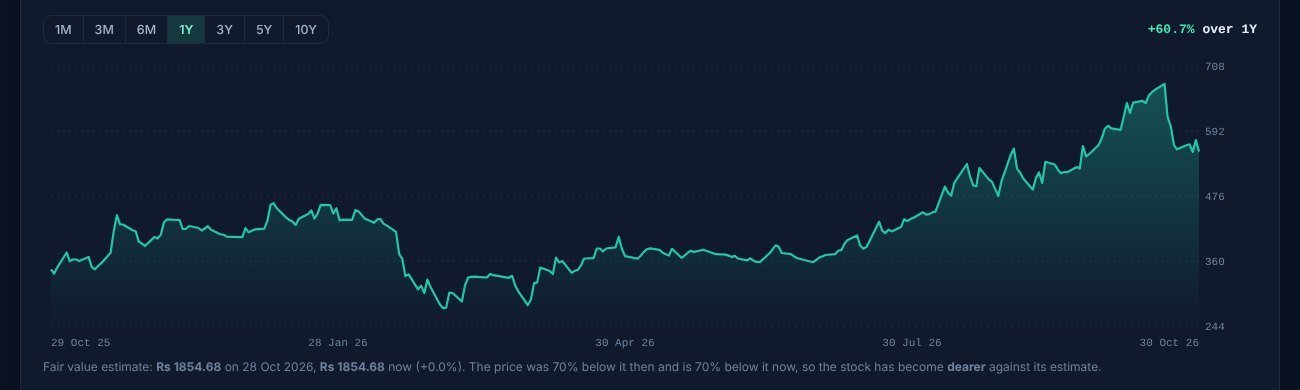
Pick a period with the buttons from 1M to 10Y; the change over that period is shown at the top right. The sentence under the chart compares the fair value estimate when it was first recorded with today’s estimate, and says whether the stock has become cheaper or dearer against it.
7. Score history and what changed
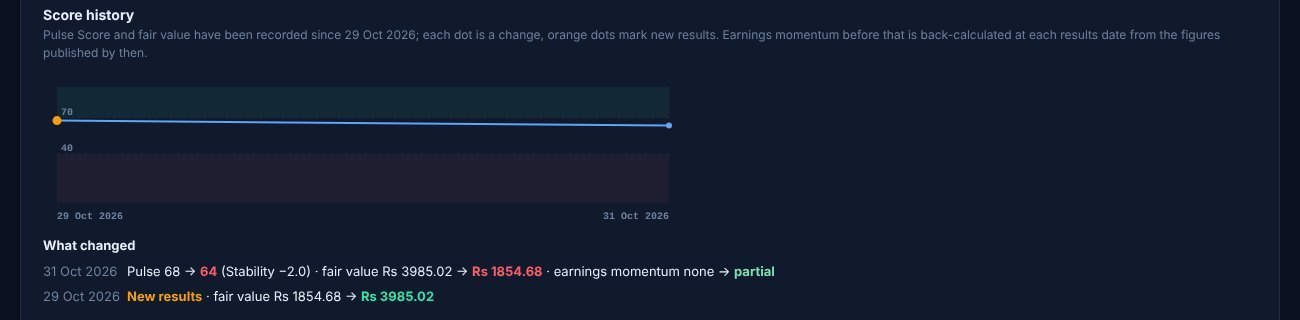
Each dot on the line is a change in the Pulse Score; orange dots mark new results. What changed lists each change in plain words, for example the Pulse Score moving from 68 to 64 because stability fell by 2 points, the fair value being revised after new results, or earnings momentum moving from none to partial. This is the quickest way to see why a stock moved up or down the list.
8. Earnings momentum at each results date
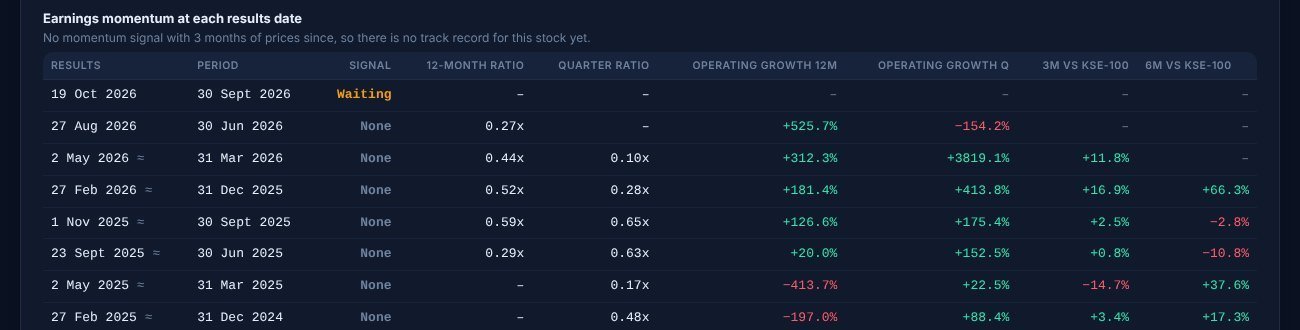
This table shows the momentum check as it stood at each past results date, so you can judge how reliable the signal has been for this company. The 12-month and quarter ratios are explained in section 12. Operating growth shows operating profit growth over each period. The last two columns show how the share price did over the following 3 and 6 months against the KSE-100.
A date marked ≈ is approximate: either the date of the board meeting that approved the results, or estimated from the period end. Rows before live recording began are back-calculated from the figures published at the time. “Waiting” means new results are in but operating profit for that quarter is not available yet, so the check cannot be run. A signal also needs three months of prices after the results date before it has a track record.
9. Key figures

A summary of the company’s size and valuation: market cap, P/E (price to earnings), P/B (price to book value), earnings per share over the last 12 months (TTM) and its growth, dividend yield, net margin, debt to equity, EV / EBITDA and revenue over the last 12 months. The line below gives the latest quarter and financial year the figures come from and when they were last updated.
10. The score breakdown
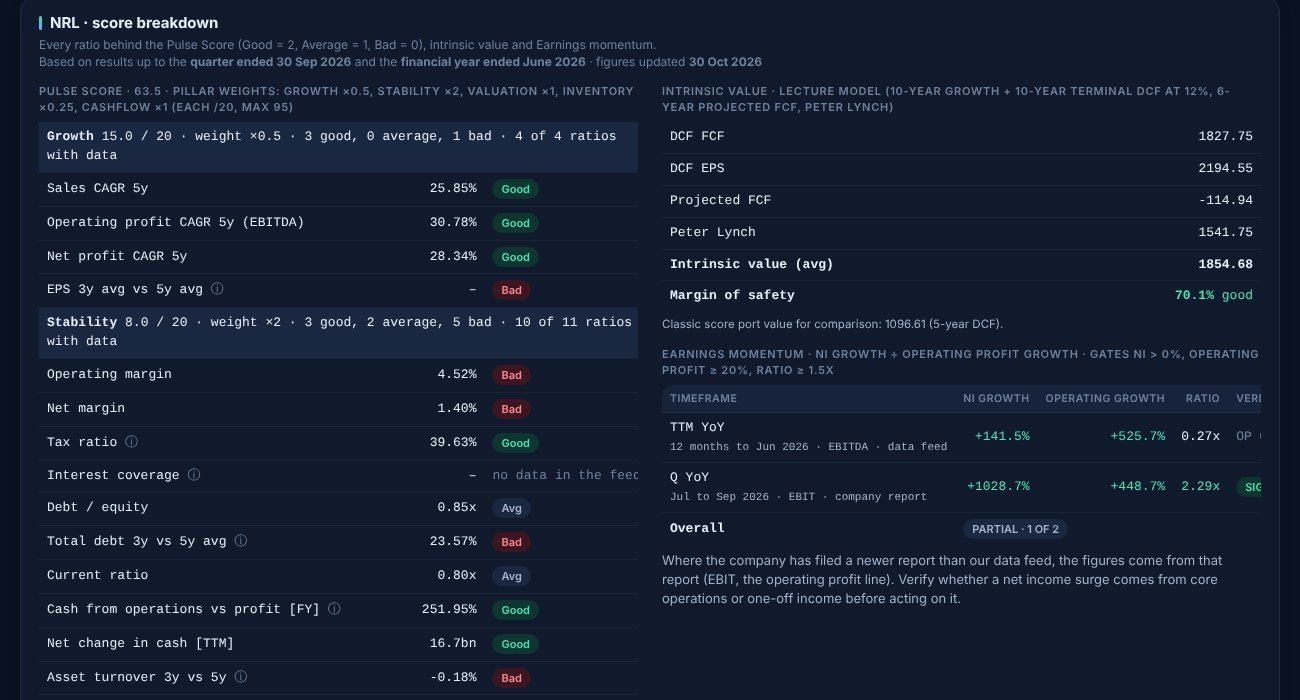
Scroll down for the full workings. The heading shows the Pulse Score and the pillar weights: growth ×0.5, stability ×2, valuation ×1, inventory ×0.25 and cash flow ×1, each out of 20, for a maximum of 95. Each ratio is rated Good (2 points), Average (1) or Bad (0), and a pillar’s score is the average of its ratios.
Each pillar line also tells you how many ratios had data. “No data” means the figure is not available for this company and is left out rather than counted as bad. An ⓘ next to a ratio opens a short explanation. Where a ratio is compared with the sector, the sector median is shown in the label, for example “Inventory turnover (sector median 10.2)”.
Below the pillars, a collapsed section shows the classic score from the 32-ratio checklist (the IF column in the list).
11. Intrinsic value: how the fair value is built
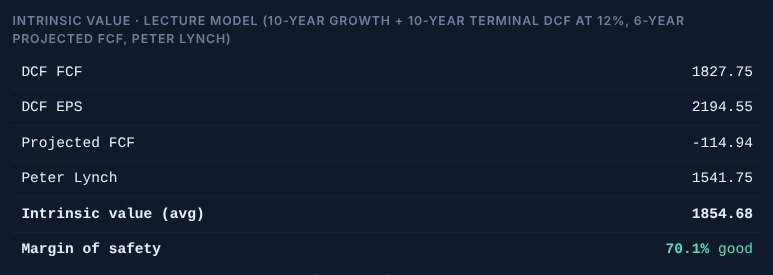
This panel shows each valuation method and the average used as the intrinsic value:
- DCF FCF and DCF EPS: discounted cash flow models using free cash flow and earnings per share, with 10 years of growth and a 10-year terminal period at a 12% discount rate.
- Projected FCF: free cash flow projected over 6 years.
- Peter Lynch: a growth-adjusted P/E value.
A method that cannot be calculated, or gives a negative value, is left out of the average. For NRL, projected free cash flow is negative (−114.94), so the average of the other three methods gives Rs 1,854.68.
Margin of safety = (intrinsic value − price) ÷ intrinsic value. NRL’s 70.1% means the price is about 30% of the estimate. Note the difference from the fair value card at the top, which shows the same gap the other way round, as upside from the price (+233.9%). Both describe the same thing.
12. Earnings momentum: the detail
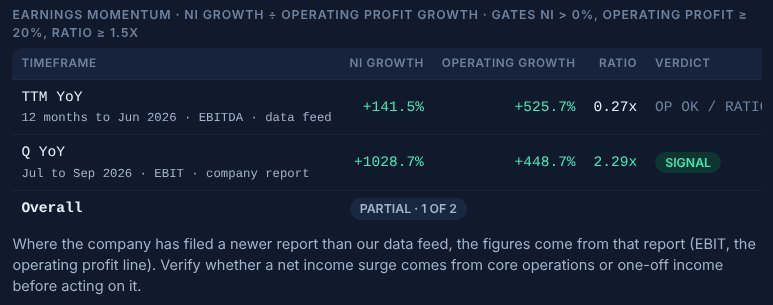
Earnings momentum looks for profit (net income) growing faster than operating profit while operating profit itself is growing strongly. Each period passes when all three conditions hold:
- Net income growth is above 0%.
- Operating profit growth is at least 20%.
- The ratio of the two (net income growth ÷ operating profit growth) is at least 1.5x.
Two periods are checked: TTM YoY, the last 12 months against the 12 months before, and Q YoY, the latest quarter against the same quarter a year earlier. Both passing gives a Full signal, one gives Partial (1 of 2), none gives No signal. If profit is falling, the result is Invalid.
The small line under each period tells you exactly what was measured and where it came from, for example “Jul to Sep 2026 · EBIT · company report”. Company report means the figures were read from the quarterly or annual report the company filed with PSX; data feed means they came from our regular financial data. When a company has filed a newer report than the data feed holds, the report is used, so the check reflects the latest quarter as soon as possible. EBIT is operating profit; EBITDA is operating profit before depreciation and amortisation.
For NRL, the September quarter passes (profit up 1,028.7%, operating profit up 448.7%, ratio 2.29x), while the 12-month period fails on the ratio (0.27x), so the verdict is Partial. A very large jump like this often comes from a small or loss-making base a year earlier, which is why the page reminds you to check whether a profit surge comes from core operations or from one-off income.
Putting it together: a simple reading routine
- Start with the four cards. They tell you in seconds whether the stock is high quality, cheap, and accelerating.
- Check the pillars for a weak spot. A single E grade can matter more than a high total.
- Read the watch-outs and the flag count. Any red flag is a reason to open the company’s report.
- Look at how the fair value is built. If the methods disagree widely, give the estimate less weight.
- Confirm momentum with the source line. Prefer signals built on the company’s own report, and check whether operating profit, not just net profit, is growing.
- Use What changed to follow the story after each set of results.
Our company results articles cover new results as they are announced, using the figures from each company’s filed report, and link back to the matching stock page.
Bilal, Market Pulse Hub
The scores, fair value estimates and signals on the dashboard are calculated automatically from published results and market prices. They are tools for research and education and are not investment advice. Always read the company’s own reports before making a decision.