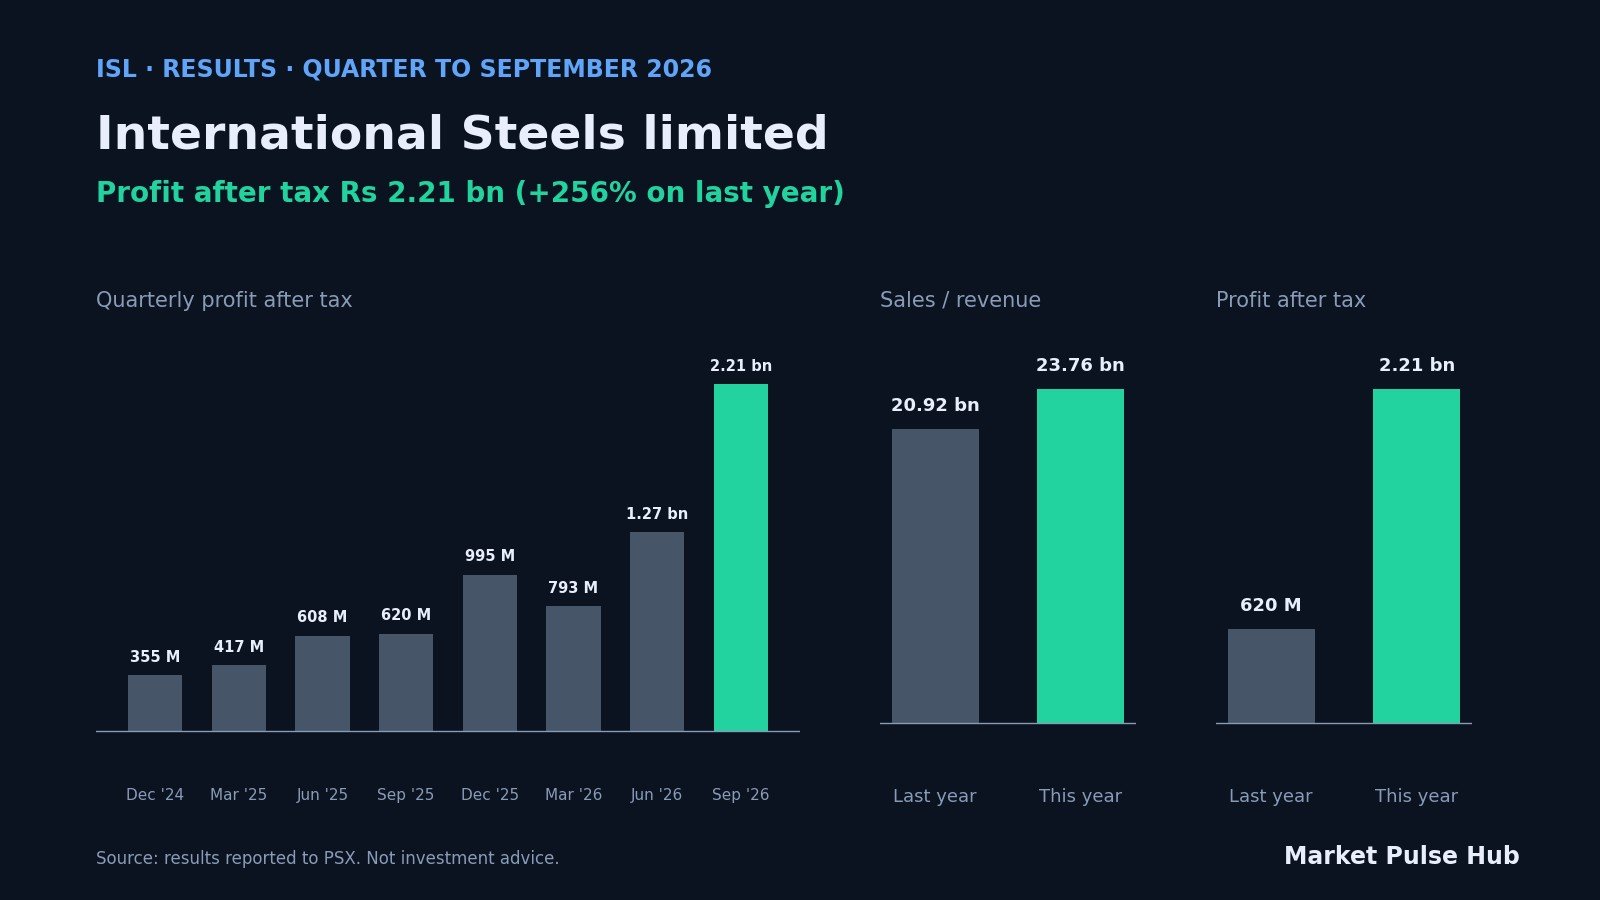
International Steels limited (PSX: ISL) announced its results for the three months to 30 September 2026 on 20 October 2026. It reported a profit after tax of Rs 2.21 bn, or Rs 5.07 a share, against a profit of Rs 620 M in the same period last year (+256%). Sales or revenue came to Rs 23.76 bn, +13.6% on a year earlier. No payout was announced with these results.
The numbers
| Quarter to September 2026 | This year | Last year | Change |
|---|---|---|---|
| Sales / revenue | Rs 23.76 bn | Rs 20.92 bn | +13.6% |
| Profit after tax | Rs 2.21 bn | Rs 620 M | +255.8% |
| Earnings per share | Rs 5.07 | Rs 1.43 | +254.5% |
| Operating profit (EBIT) | Rs 2.35 bn | Rs 1.42 bn | +65.5% |
| Profit before tax | Rs 3.46 bn | Rs 984 M | +251.9% |
| Net margin | 9.3% | 3.0% | |
| Operating margin | 9.9% | 6.8% | |
| Effective tax rate | 36.2% | 36.9% |
Operations or tax?
Operating profit (EBIT) grew +65%, profit before tax rose +252% and profit after tax rose +256%. Below the operating line, finance costs and other income added to growth. The tax rate was much the same as a year earlier, so the profit change reflects the business itself.
Quarter by quarter
Profit after tax for each of the last quarters, with operating profit (EBITDA) where available, against the same quarter a year earlier.
| Quarter | Profit | vs year ago | Operating profit |
|---|---|---|---|
| Sep 2026 | Rs 2.21 bn | +256% | Rs 3.02 bn |
| Jun 2026 | Rs 1.27 bn | +108% | Rs 2.83 bn |
| Mar 2026 | Rs 793 M | +90% | Rs 2.35 bn |
| Dec 2025 | Rs 995 M | +180% | Rs 2.28 bn |
| Sep 2025 | Rs 620 M | +246% | Rs 1.94 bn |
| Jun 2025 | Rs 608 M | +2% | Rs 1.56 bn |
| Mar 2025 | Rs 417 M | −41% | Rs 1.39 bn |
| Dec 2024 | Rs 355 M | −71% | Rs 1.45 bn |
Over the last 12 months the company earned Rs 5.26 bn, against Rs 2.00 bn in the 12 months before (+163%). Profit grew year on year in 4 of the last 4 quarters.
The net margin widened to 9.3% from 3.0% a year earlier, so profit grew faster than sales.
Against its sector
4 other companies in the Engineering sector on our list have reported for the same period. Their median profit change is −55%; ISL’s +256% is ahead of the median and better than 3 of 4.
Best in the sector so far: ASL (+310%), INIL (−55%), MUGHAL (−78%), CSAP (−123%).
Valuation
| Price to earnings, last 12 months | 6.7x (sector median 7.6x) |
| Price to book value | 1.21x |
| Dividend yield, last 12 months | 6.5% |
| Our fair value estimate | Rs 115.94 (margin of safety +30%) |
| Pulse Score | 44 / 100 |
| Market value | Rs 35.11 bn |
| 52-week range | Rs 65.45 to Rs 123.00 |
On this measure the shares trade below the typical company in the Engineering sector, which can reflect lower expected growth or higher risk as well as value.
Earnings momentum
Over the last 12 months profit after tax changed by +163.0% and operating profit by +65.2% on the year before; in the latest quarter against a year earlier the figures were +255.8% and +65.5%. Our earnings momentum check, which looks for profit and operating profit accelerating together, shows a full signal. It is one input to the Pulse Score, not a recommendation. These figures may not yet include the quarter just announced.
Market reaction
The share price has moved +3.5% since the close before the announcement (Rs 77.97 to Rs 80.71 on 4 November 2026), against +3.6% for the KSE-100 over the same days.
Dividend record
The company paid a cash dividend in 9 of the last 10 years, Rs 5.00 a share over the last 12 months, with dividends growing −13% a year over five years.
What to watch
- The full report. The company’s quarterly report, with the directors’ review, usually follows within a few weeks and explains what drove the change.
- Next results. The next set of results is expected around 27 February 2027.
The full picture, with the score breakdown, fair value estimate and price history, is on the ISL page of the Market Pulse Hub dashboard.
Bilal, Market Pulse Hub
Source: results as reported to the Pakistan Stock Exchange on 20 October 2026, with operating profit and profit before tax from the company’s report filed with PSX; prices and payouts from PSX. Changes, margins and valuation ratios are our calculations. This article is generated automatically from the reported figures and does not include the company’s own commentary. It is for information only and is not investment advice.