Intrinsic value is an estimate of what a share is really worth, based on the business behind it rather than on today’s market price. The margin of safety is the gap between that estimate and the price. The idea comes from Benjamin Graham, Warren Buffett’s teacher: because any estimate of value can be wrong, buy only when the price is well below it, so that you are protected if you are wrong.
The margin of safety formula
Margin of safety = (Intrinsic value − Share price) ÷ Intrinsic value × 100
A margin of safety of 40% means the price is 60% of the estimated value. A negative margin of safety means the price is above the estimate.
How intrinsic value is estimated
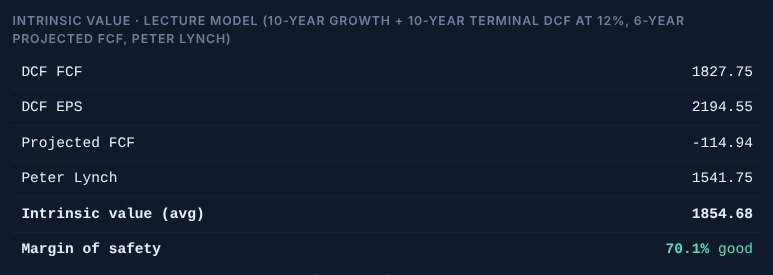
There is no single formula. Our dashboard averages up to four methods:
- DCF on free cash flow: projects free cash flow for 10 years at the company’s growth rate, adds a terminal period, and discounts everything back to today at 12% a year.
- DCF on earnings: the same approach using earnings per share.
- Projected free cash flow: a shorter, 6-year projection.
- Peter Lynch value: a growth-adjusted P/E, which values a company at a P/E equal to its growth rate.
Methods that cannot be calculated, or that come out negative, are left out.
Worked example: Lucky Cement (LUCK)
| Method | Value per share |
|---|---|
| DCF FCF | Rs 355.82 |
| DCF EPS | Rs 1,730.29 |
| Projected FCF | Rs 441.66 |
| Peter Lynch | Rs 1,215.59 |
| Average (intrinsic value) | Rs 935.84 |
With the share price at Rs 391.38 on 30 October 2026, the margin of safety is (935.84 − 391.38) ÷ 935.84 = 58%.
Notice how far apart the four methods are, from Rs 355.82 to Rs 1,730.29. The earnings-based methods are high because Lucky’s profit has grown fast; the cash flow methods are lower because a lot of cash went into new investment. When the methods disagree this much, treat the average with caution and find out why.
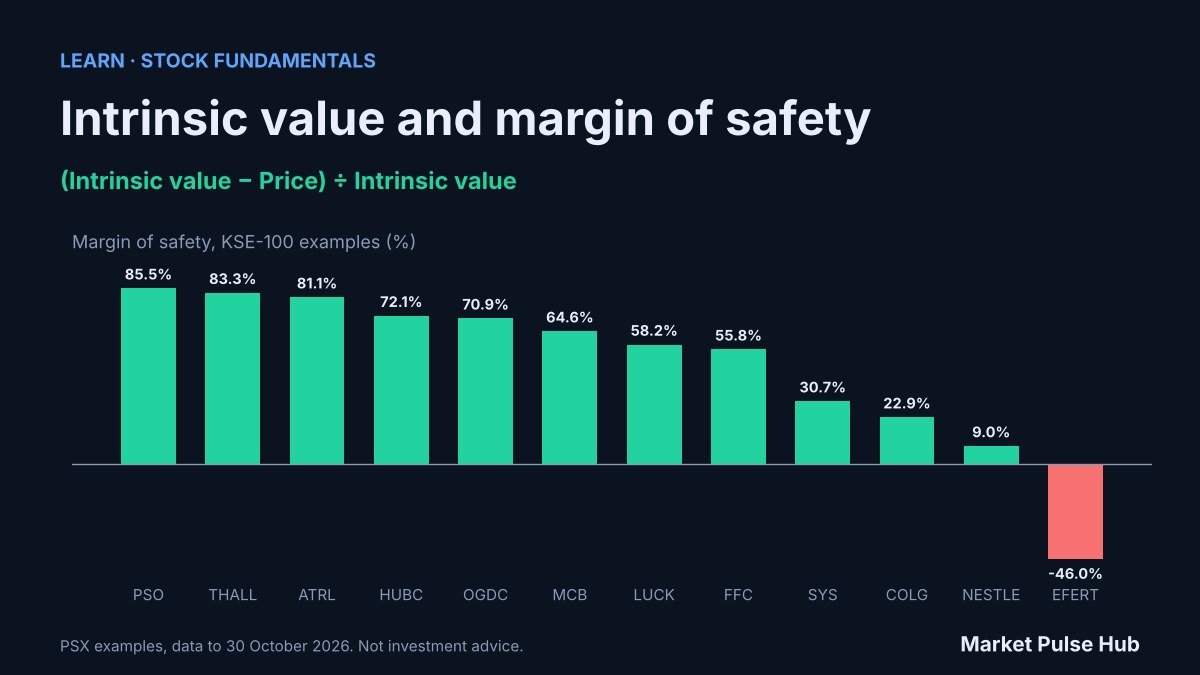
Margins of safety across the KSE-100
| Stock | Company | Share price | Intrinsic value | Margin of safety |
|---|---|---|---|---|
| PSO | Pakistan State Oil Co. Ltd. Class I | Rs 355.44 | Rs 2,446.39 | 85% |
| ATRL | Attock Refinery | Rs 1,088.78 | Rs 5,764.23 | 81% |
| THALL | Thal | Rs 500.00 | Rs 2,988.28 | 83% |
| HUBC | Hub Power Co. | Rs 193.18 | Rs 693.11 | 72% |
| OGDC | Oil & Gas Development Co. | Rs 306.78 | Rs 1,053.23 | 71% |
| MCB | MCB Bank | Rs 397.52 | Rs 1,123.96 | 65% |
| LUCK | Lucky Cement | Rs 391.38 | Rs 935.84 | 58% |
| FFC | Fauji Fertilizer Co. | Rs 559.49 | Rs 1,267.21 | 56% |
| SYS | Systems | Rs 109.15 | Rs 157.49 | 31% |
| COLG | Colgate-Palmolive (Pakistan) | Rs 1,179.42 | Rs 1,530.13 | 23% |
| NESTLE | Nestle Pakistan | Rs 7,045.00 | Rs 7,738.88 | 9% |
| EFERT | Engro Fertilizers | Rs 194.99 | Rs 133.56 | −46% |
Many PSX stocks show large margins of safety on these models. That partly reflects the high discount rates Pakistani investors demand, and partly that growth rates from recent years of high inflation may not continue. A large margin of safety is a reason to look closer, not a reason to buy.
Limits of intrinsic value
- Garbage in, garbage out. Small changes in the growth rate or discount rate change the result a lot.
- Past growth is not future growth, especially for cyclical companies at the top of their cycle.
- Accounting profit in inflationary times can overstate real growth.
- Banks and holding companies do not suit cash flow models well; price to book is often better.
How to find it on Market Pulse Hub
The Fair value card at the top of each stock page on the dashboard shows the estimate and how far the price is from it, the Fair value range shows each method, and the stock list has an MoS column. The quick filter “Margin of safety ≥ 25%” lists stocks priced at least 25% below their estimate.
Frequently asked questions
Why does the fair value card show +233% while the margin of safety is 70%?
They measure the same gap from opposite ends. Upside is measured from the price (value ÷ price − 1); margin of safety is measured from the value (1 − price ÷ value).
What margin of safety should I look for?
Graham suggested at least a third. The less certain the business, the bigger the margin you should want.
Is intrinsic value the same as a target price?
No. A target price is a broker’s forecast of where the price may go in a year. Intrinsic value is an estimate of what the business is worth, regardless of when the market recognises it.
Related terms
Bilal, Market Pulse Hub
Figures are from company results and closing prices up to 30 October 2026 and will change as new results and prices arrive. Ratios are our calculations or come from our financial data, and other sources may show slightly different values because of different definitions or dates. This article is for education only and is not investment advice.