Daily market reports in Pakistan usually say whether foreign investors were net buyers or sellers and which local groups took the other side. This guide explains the FIPI LIPI meaning, how to read the daily numbers and what a year of flow data says about who has been driving the KSE-100. All figures are net buying or selling by value, from NCCPL data for 250 trading days from 30 October 2025 to 30 October 2026.
FIPI LIPI meaning: foreign and local portfolio investment
FIPI (Foreign Investors Portfolio Investment) is the value of shares foreign investors bought on the exchange minus the value they sold. In the NCCPL data it is made up of foreign corporates, foreign individuals and overseas Pakistanis. LIPI (Local Investors Portfolio Investment) covers everyone else: local individuals, companies, banks and development finance institutions, NBFCs, mutual funds, insurance companies, other organisations and brokers trading on their own book.
Because every trade has a buyer and a seller, net FIPI and net LIPI always add up to zero. If foreigners are net sellers of Rs 2 bn on a given day, local investors were net buyers of Rs 2 bn. The interesting question is never “did locals buy?” but “which locals bought, and how much?”
Who bought and who sold over the last 12 months
Over the period, foreign investors were net sellers of Rs 213.8 bn, about US$ 765 million. Local investors took the other side. The biggest local buyers were companies (Rs 160.8 bn), local individuals (Rs 84.5 bn) and mutual funds (Rs 28.7 bn). The largest local sellers were insurance companies (Rs 54.4 bn net sold) and banks and DFIs (Rs 15.8 bn).
| Investor group | Side | Net buying (+) or selling (-), Rs bn |
|---|---|---|
| Foreign corporates | Foreign (FIPI) | -235.9 |
| Insurance companies | Local (LIPI) | -54.4 |
| Banks / DFIs | Local (LIPI) | -15.8 |
| Brokers (own book) | Local (LIPI) | -3.5 |
| Foreign individuals | Foreign (FIPI) | -1.0 |
| NBFCs | Local (LIPI) | +1.2 |
| Other organisations | Local (LIPI) | +12.2 |
| Overseas Pakistanis | Foreign (FIPI) | +23.2 |
| Mutual funds | Local (LIPI) | +28.7 |
| Local individuals | Local (LIPI) | +84.5 |
| Companies | Local (LIPI) | +160.8 |
| All foreign (FIPI) | -213.8 |
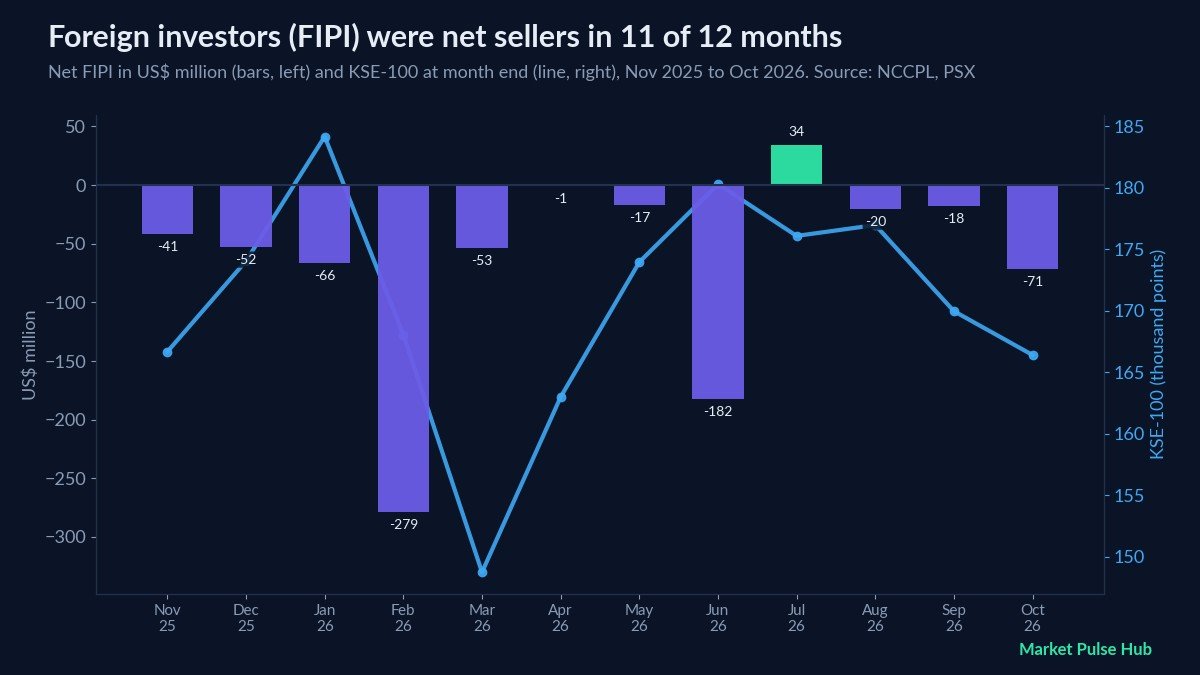
Over the same period the KSE-100 rose from 158,465.06 on 29 October 2025 to 166,409.25 on 30 October 2026, a gain of 5.0%. In other words, a year of heavy foreign selling did not stop the index from rising, as local money absorbed it.
Month by month
Foreign investors were net buyers in only 1 of the 12 full months (Jul 2026). The heaviest selling month was Feb 2026, at Rs 78.1 bn (US$ 279 million). On a daily count, foreigners were net buyers on 75 days and net sellers on 175.
| Month | FIPI net, Rs bn | FIPI net, US$ m | Local individuals, Rs bn | Mutual funds, Rs bn | KSE-100 at month end | KSE-100 change |
|---|---|---|---|---|---|---|
| Oct 2025 (30 to 31 Oct) | +0.5 | +1.9 | -0.3 | -1.2 | 161,632 | |
| Nov 2025 | -11.7 | -41.3 | +5.8 | +1.4 | 166,678 | +3.12% |
| Dec 2025 | -14.7 | -52.4 | +11.6 | +15.3 | 174,054 | +4.43% |
| Jan 2026 | -18.6 | -66.5 | +6.8 | +26.7 | 184,174 | +5.81% |
| Feb 2026 | -78.1 | -279.0 | +0.0 | +12.6 | 168,062 | -8.75% |
| Mar 2026 | -14.9 | -53.3 | +13.5 | -15.6 | 148,743 | -11.50% |
| Apr 2026 | -0.2 | -0.8 | +16.4 | +6.1 | 162,994 | +9.58% |
| May 2026 | -4.8 | -17.2 | +0.2 | -0.1 | 173,963 | +6.73% |
| Jun 2026 | -50.6 | -182.2 | -7.2 | +13.4 | 180,302 | +3.64% |
| Jul 2026 | +9.6 | +34.4 | +6.6 | -8.4 | 176,094 | -2.33% |
| Aug 2026 | -5.6 | -20.1 | +8.8 | +2.4 | 176,976 | +0.50% |
| Sep 2026 | -4.9 | -17.7 | +10.3 | -11.8 | 169,969 | -3.96% |
| Oct 2026 | -19.7 | -71.3 | +11.9 | -12.1 | 166,409 | -2.09% |
The table shows why flows need care. Months of strong local buying by mutual funds, such as Jan 2026, came with a rising index, but the link is loose. In Mar 2026 mutual funds sold a net Rs 15.6 bn and the KSE-100 fell 11.5%, while in Jun 2026 foreign investors sold Rs 50.6 bn and the index still rose 3.6%.
The biggest single days
A handful of days can dominate a year of flows. The two heaviest foreign selling days together came to Rs 99.2 bn, which is 46% of the full-year net foreign outflow. Single-day spikes of this size usually come from one or a few very large transactions rather than broad selling, so check the day’s news and block deals before reading much into them. The three biggest selling and buying days were:
| Date | FIPI net, Rs bn | US$ m | KSE-100 that day |
|---|---|---|---|
| 20 February 2026 | -55.4 | -197.8 | +0.58% |
| 23 June 2026 | -43.8 | -157.7 | -0.44% |
| 30 October 2026 | -12.4 | -44.9 | -0.47% |
| 16 July 2026 | +2.5 | +9.1 | +1.62% |
| 9 July 2026 | +2.2 | +8.0 | -0.20% |
| 17 July 2026 | +1.7 | +6.1 | -1.30% |
Which sectors foreigners bought and sold
Our sector breakdown starts on 6 August 2026, so this table covers 6 August 2026 to 30 October 2026. Over that period foreign investors sold most heavily in banks and all other sectors combined, while their largest net purchases were in power and fertilizer.
| Sector | FIPI net, Rs bn | Local individuals, Rs bn | Mutual funds, Rs bn |
|---|---|---|---|
| Banks | -16.5 | +9.1 | -1.2 |
| All other sectors | -10.7 | +6.6 | -10.9 |
| Cement | -2.8 | +4.3 | -5.2 |
| Oil & Gas Marketing | -1.7 | +0.3 | +2.2 |
| Technology | -1.5 | +3.3 | -1.3 |
| Food & Personal Care | +0.0 | +0.4 | -1.2 |
| Oil & Gas Exploration | +0.1 | +3.4 | -1.1 |
| Textile Composite | +0.3 | +0.6 | -1.0 |
| Fertilizer | +0.3 | +2.1 | -1.6 |
| Power | +0.6 | +3.1 | -3.4 |
How to use FIPI and LIPI data
- Look at trends, not single days. A 20-day or monthly total says more than one session, especially when a big block trade distorts the figure.
- Watch which local group is buying. Mutual funds and insurers are professional investors with research teams; buying by individuals can be more short-term.
- Combine flows with fundamentals. Flows explain who moved prices, not whether a company is good value. Pair them with earnings and valuation, for example through our PSX stock screener guide, or read our KSE Allocation guide for how interest rates shape the case for shares.
- Follow it daily. The Smart Money section of the Market Pulse Hub dashboard updates flows by group and sector after each session, and our weekly PSX recap summarises the week.
Frequently asked questions
What is the FIPI LIPI meaning in simple words?
FIPI stands for Foreign Investors Portfolio Investment and shows whether foreign investors bought more shares than they sold on the Pakistan Stock Exchange. LIPI stands for Local Investors Portfolio Investment and shows the same for Pakistani investors such as individuals, companies, banks, mutual funds and insurers.
Who publishes FIPI and LIPI data?
The figures come from the National Clearing Company of Pakistan Limited (NCCPL), which clears and settles trades on the exchange. Figures are published for each trading day and are widely quoted in market reports.
Does foreign selling mean the KSE-100 will fall?
Not necessarily. Over the 12 months to 30 October 2026, foreign investors were net sellers of Rs 213.8 bn while the KSE-100 rose from 158,465 to 166,409, as local buyers absorbed the selling. Flows are one input among many, alongside earnings, interest rates and the economy.
Why are FIPI and LIPI always equal and opposite?
Every share bought has a seller. If foreign investors sell a net Rs 1 bn, local investors as a group must have bought a net Rs 1 bn, give or take rounding. That is why it is more useful to look at which local groups did the buying.
Where can I track investor flows every day?
The Smart Money section of the Market Pulse Hub dashboard shows daily NCCPL flows by investor group and sector, along with the regime model that tracks whether foreign and local institutions are buying or selling together.
Join the Market Pulse Hub waitlist to get early access to full stock pages, scores and alerts for Pakistani investors.
Bilal, Market Pulse Hub
Figures are from company results, exchange data and our calculations up to 30 October 2026 and will change as new data arrives. This article is for education only and is not investment advice.