The KSE-100 index gained 154.81 points (+0.09%) on Monday, 2 November 2026, to close at 166,564.06. The day’s range was 165,585.42 to 166,989.76. Breadth was narrow: 36 of the 100 index stocks rose, 64 fell and 0 were unchanged. MARI (Mari Energies Limited) did the most work, adding 171 points on a +3.15% move.
The index is 11.9% below its 52-week high of 189,167; the year-to-date return is −4.30%.
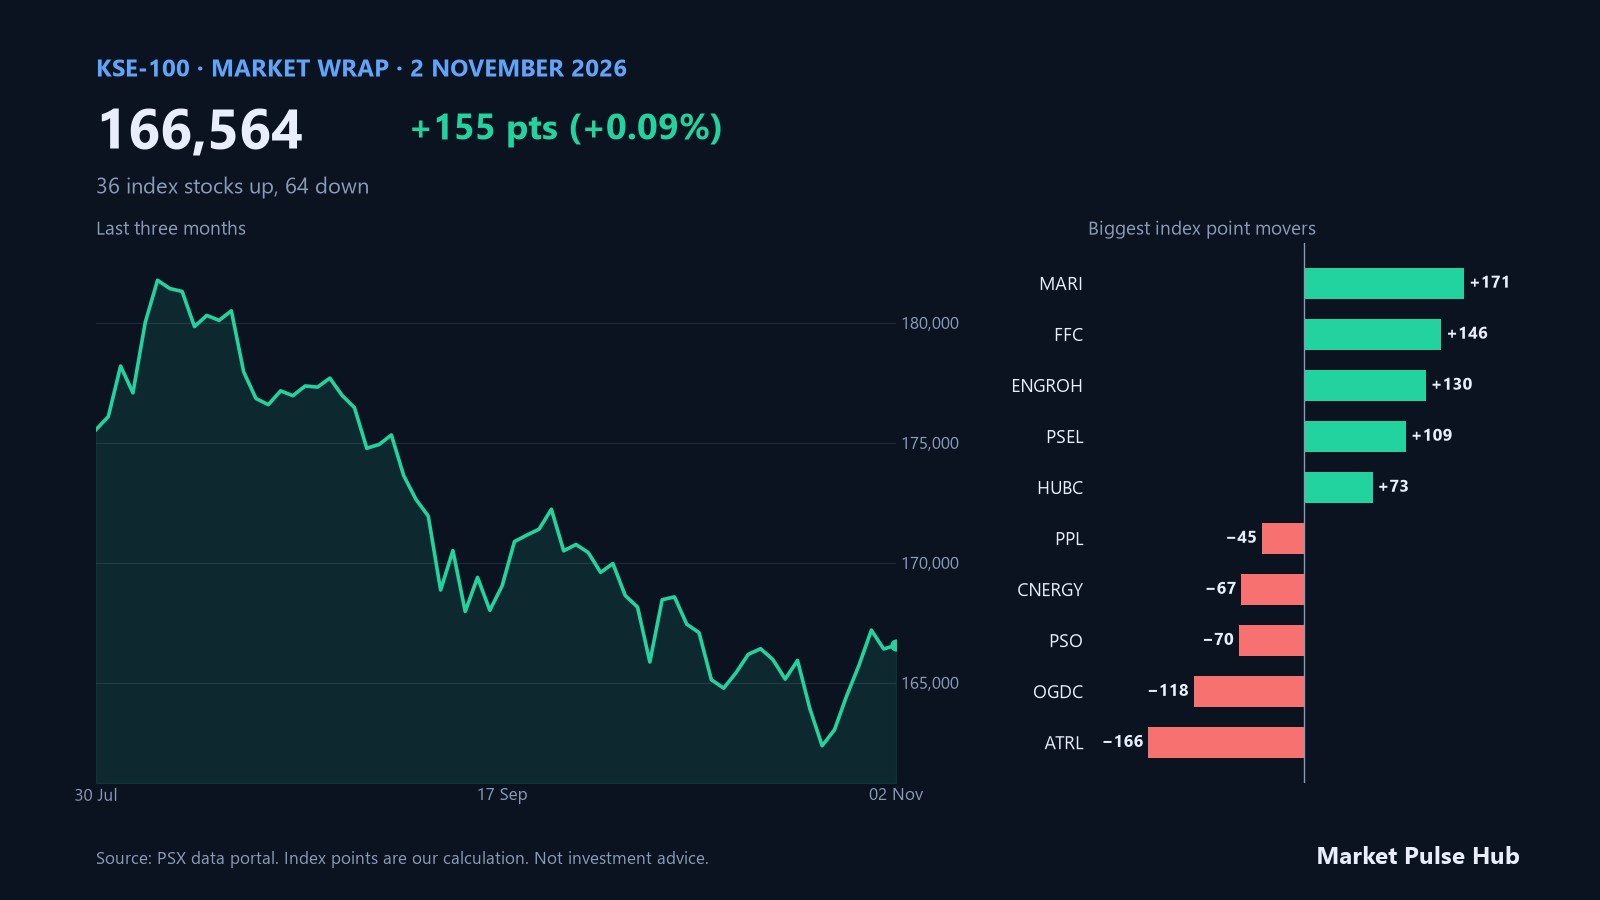
Index snapshot
| KSE-100 | Value |
|---|---|
| Close | 166,564.06 |
| Change | +154.81 (+0.09%) |
| Day high / low | 166,989.76 / 165,585.42 |
| 1 week | +2.16% |
| 1 month | −0.95% |
| 3 months | −6.53% |
| Year to date | −4.30% |
| 1 year | +6.27% |
| 52-week high / low | 189,166.83 / 146,480.15 |
| 50-day / 200-day average | 169,514 / 171,410 |
| Volume, 100 index stocks | 180.5 M shares |
| Market value of index stocks | Rs 4.66 tn |
The index sits below both its 50-day and 200-day averages, a sign the trend has weakened.
Other indices
| Index | Close | Change |
|---|---|---|
| KSE-30 | 49,003.43 | −23.22 (−0.05%) |
| KMI-30 (Shariah) | 238,226.41 | +254.67 (+0.11%) |
| All Share | 100,339.40 | −368.37 (−0.37%) |
| KMI All Share | 64,845.15 | −178.82 (−0.28%) |
| Banks (BKTI) | 45,722.23 | −222.00 (−0.48%) |
| Oil & Gas (OGTI) | 33,664.20 | +15.63 (+0.05%) |
| PSX Dividend 20 | 76,134.18 | +193.77 (+0.26%) |
Who moved the index
Index points show how much each stock added to or took away from the KSE-100’s move, combining its price change with its weight. The top five contributors added 629 points and the bottom five took away 465, so a handful of heavyweights explain most of the day’s 155-point move.
| Added points | Change | Points |
|---|---|---|
| MARI Mari Energies Limited | +3.15% | +170.7 |
| FFC Fauji Fertilizer Company Limited | +0.92% | +146.4 |
| ENGROH Engro Holdings Limited | +1.57% | +129.9 |
| PSEL Pakistan Services Limited | +10.00% | +108.6 |
| HUBC The Hub Power Company Limited | +1.09% | +73.1 |
| LUCK Lucky Cement Limited | +1.06% | +65.1 |
| FCCL Fauji Cement Company Limited | +2.93% | +47.0 |
| NBP National Bank of Pakistan | +1.58% | +46.0 |
| Took away points | Change | Points |
|---|---|---|
| ATRL Attock Refinery Limited | −10.00% | −166.1 |
| OGDC Oil & Gas Development Company Limited | −1.66% | −117.7 |
| PSO Pakistan State Oil Company Limited | −2.33% | −69.6 |
| CNERGY Cnergyico PK Limited | −9.97% | −66.8 |
| PPL Pakistan Petroleum Limited | −0.87% | −44.8 |
| DCR Dolmen City REIT | −3.83% | −30.0 |
| POL Pakistan Oilfields Limited | −0.95% | −29.4 |
| SCBPL Standard Chartered Bank (Pak) Ltd | −6.61% | −27.3 |
Sector performance
Fertilizer contributed the most (+335 points, stocks up +1.12% on a weighted basis) and Oil & Gas the least (−326 points).
| Sector | Index weight | Weighted change | Index points | Up / down |
|---|---|---|---|---|
| Fertilizer | 18.1% | +1.12% | +335.0 | 4 / 0 |
| Cement | 8.8% | +1.05% | +150.7 | 6 / 4 |
| Services | 0.7% | +10.00% | +108.6 | 1 / 0 |
| Power & Utilities | 5.9% | +0.46% | +43.0 | 3 / 5 |
| Banks | 30.9% | +0.04% | +16.4 | 6 / 8 |
| Insurance & Financials | 0.9% | +0.18% | +2.8 | 1 / 3 |
| Glass & Materials | 0.5% | +0.03% | +0.3 | 1 / 0 |
| Textile | 1.4% | −0.30% | −1.1 | 1 / 4 |
| Transport | 0.2% | −1.16% | −4.8 | 0 / 1 |
| Autos | 3.4% | −0.13% | −7.8 | 2 / 5 |
| Chemicals & Industries | 1.1% | −0.40% | −8.0 | 2 / 6 |
| Pharmaceuticals | 2.7% | −0.19% | −8.9 | 3 / 5 |
| Engineering & Steel | 1.1% | −0.53% | −10.6 | 1 / 3 |
| Consumer Durables | 1.0% | −0.69% | −12.0 | 0 / 2 |
| Other | 0.8% | −1.59% | −23.9 | 2 / 1 |
| Food & Consumer | 2.9% | −0.60% | −29.0 | 2 / 6 |
| Technology | 3.6% | −1.17% | −70.2 | 0 / 4 |
| Oil & Gas | 15.8% | −1.11% | −325.7 | 1 / 7 |
Top gainers, losers and most active
Among the 100 index stocks.
| Top gainers | Close | Change |
|---|---|---|
| PSEL Pakistan Services Limited | 1,083.71 | +10.00% |
| MARI Mari Energies Limited | 651.40 | +3.15% |
| BNWM Bannu Woollen Mills Limited | 61.19 | +3.01% |
| FCCL Fauji Cement Company Limited | 53.81 | +2.93% |
| ISL International Steels Limited | 79.57 | +2.76% |
| HGFA HBL Growth Fund | 13.34 | +2.62% |
| DGKC D.G. Khan Cement Company Limited | 182.36 | +2.36% |
| MLCF Maple Leaf Cement Factory Limited | 91.96 | +1.60% |
| Top losers | Close | Change |
|---|---|---|
| ATRL Attock Refinery Limited | 979.95 | −10.00% |
| CNERGY Cnergyico PK Limited | 12.28 | −9.97% |
| SCBPL Standard Chartered Bank (Pak) Ltd | 55.63 | −6.61% |
| IBFL Ibrahim Fibres Limited | 245.02 | −4.51% |
| DCR Dolmen City REIT | 37.93 | −3.83% |
| YOUW Yousaf Weaving Mills Limited | 4.34 | −3.56% |
| AIRLINK Air Link Communication Limited | 108.53 | −3.42% |
| BML Bank Makramah Limited | 56.44 | −3.24% |
| Most active | Close | Volume |
|---|---|---|
| CNERGY Cnergyico PK Limited | 12.28 | 93.1 M shares |
| KEL K-Electric Limited | 5.64 | 8.1 M shares |
| PIBTL Pakistan International Bulk Terminal | 12.78 | 7.1 M shares |
| BOP The Bank of Punjab | 28.10 | 6.3 M shares |
| MLCF Maple Leaf Cement Factory Limited | 91.96 | 5.1 M shares |
| FCCL Fauji Cement Company Limited | 53.81 | 4.2 M shares |
| THCCL Thatta Cement Company Limited | 73.49 | 4.1 M shares |
| NPL Nishat Power Limited | 50.51 | 2.9 M shares |
Off-market blocks
PSX publishes the day’s negotiated (off-market) trades after 5 pm, after this wrap goes out. They appear in the Off-market section of the dashboard each evening.
Investor flows (latest available: 30 October 2026)
NCCPL publishes net buying and selling by investor type the following morning, so this is the most recent session available, not today’s. A positive number means that group bought more than it sold.
| Investor type | Net |
|---|---|
| Other organisations | Rs 13.54 bn |
| Foreign corporates | −Rs 12.85 bn |
| Companies | −Rs 1.39 bn |
| Banks and DFIs | −Rs 763 M |
| Brokers (own book) | Rs 711 M |
| Local individuals | Rs 697 M |
| Mutual funds | −Rs 601 M |
| Overseas Pakistanis | Rs 410 M |
Over the last 20 sessions, foreign investors are net sellers (about US$ 73.2 M) and mutual funds net sellers (−Rs 10.31 bn). Our flow regime reads Institutions selling.
What to watch
- Recovery towards 189,167. The 52-week high is 11.9% above today’s close.
- The 50-day average near 169,514. Reclaiming it would repair the short-term trend.
- Leadership. Whether MARI, FFC, ENGROH keep leading, or the gains broaden to more stocks.
Every number in this wrap updates live in the Market Pulse Hub dashboard under PSX, Market Today: the full table of 100 stocks, a sector heatmap, investor flows and off-market blocks.
Bilal, Market Pulse Hub
Source: Pakistan Stock Exchange data portal (index, constituents and off-market transactions) and NCCPL (investor flows), data as of 15:38 PKT on 2 November 2026. Sector groupings, index-point attributions and averages are our calculations. This article is generated from market data for education and information only and is not investment advice.