The Pakistan economy in September 2026 sent mixed signals. Inflation cooled to 10.3% from 11.1% in August. Foreign exchange reserves jumped to $26.77 billion, the highest on record. The tax collector met its monthly target. But stocks did not celebrate: the KSE-100 fell 3.96% over the month, and every major sector ended in the red. This review walks through the official numbers, what our leading indicators say, and how PSX sectors and investor groups behaved.
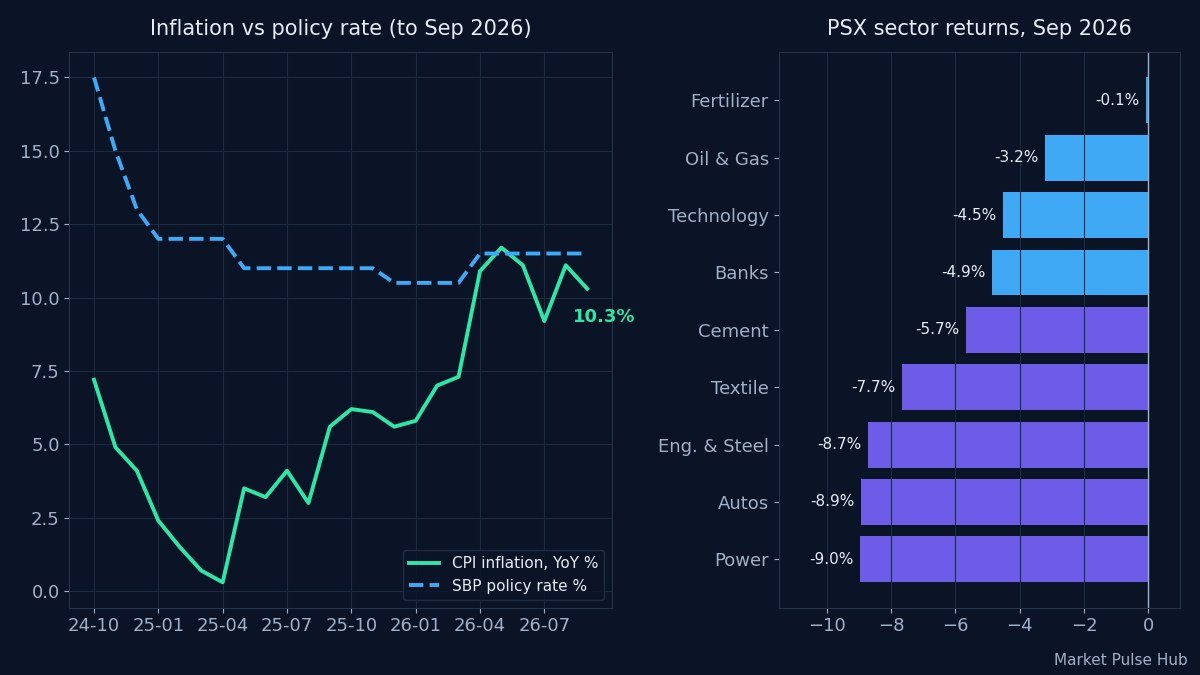
Pakistan economy September 2026 at a glance
| Indicator | September 2026 | Previous |
|---|---|---|
| CPI inflation (YoY) | 10.3% | 11.1% (Aug) |
| CPI change in the month | +1.3% | +1.2% (Aug) |
| SBP policy rate | 11.5% | 11.5% (Aug) |
| Trade balance | Rs 988 bn deficit | Rs 916 bn deficit (Aug) |
| FX reserves (total) | $26.77 bn | $22.03 bn (Aug) |
| USD/PKR | 276.83 | 277.23 (Aug) |
| REER (2010 = 100) | 108.9 | 107.9 (Aug) |
| FBR collection | Rs 1,344 bn (target Rs 1,343 bn) | Rs 901 bn (target Rs 930 bn, Aug) |
| Cement despatches (total) | 4.62 mn tons, +6.0% YoY | Domestic -1.1% YoY (Aug) |
| Broad money M2 (YoY) | +12.1% | +10.9% (Aug) |
| KSE-100 in the month | -3.96% | 176,976 at end-August |
Inflation and interest rates
Consumer prices rose 10.3% from a year earlier in September 2026, down from 11.1% in August. That is still a high rate: the CPI index rose another 1.3% within the month itself, so the slowdown is about the year-on-year comparison, not prices falling. Inflation has been above 10% in five of the last six months, after dropping as low as 0.3% in April 2025.
The State Bank kept the policy rate at 11.5% through September. With inflation at 10.3%, the real interest rate (policy rate minus inflation) was only about +1.2 percentage points. A thin real rate means savers are barely ahead of inflation, which is one reason the SBP raised the policy rate to 12% at its meeting on 26 October.
In the bond market, the 10-year PIB cut-off yield was 12.5% at the 18 September auction, about 1 point above the policy rate. A gap of about 1 point is a flat yield curve: investors are not demanding much extra return to lend for ten years, a sign they expect rates to stay near current levels rather than fall sharply. The October auction then cleared at 12.85%. If you want to see how the policy rate feeds into a stocks and bonds mix, read our KSE Allocation guide.
Trade, reserves and the rupee
The trade deficit widened to Rs 988 billion in September 2026, from Rs 916 billion in August and 4.6% wider than the Rs 945 billion deficit of September 2025. Oil is part of the story: Brent crude was close to $98 a barrel in September, against about $66 a year earlier, which raises Pakistan’s import bill.
Reserves told a very different story. Total foreign exchange reserves climbed to $26.77 billion at the end of September, up $4.7 billion in a single month. News reports, including PKRevenue and Mettis Global, linked the jump mainly to the arrival of Eurobond proceeds, which lifted the State Bank’s own reserves to a record of about $21.4 billion. Borrowed money still has to be repaid, but a bigger reserve buffer makes the rupee and import payments far less fragile in the near term.
The rupee was steady at about 276.8 per dollar, a touch stronger than August. Adjusted for inflation, it looks expensive: the Real Effective Exchange Rate (REER) rose to 108.9 in September, well above its 10-year average of about 102.4. A REER above 105 means Pakistan’s prices have risen faster than its trading partners’ without the currency adjusting, which can hurt exporters over time.
Tax collection and activity
The FBR collected Rs 1,344 billion in September 2026 against a target of Rs 1,343 billion, meeting the target and growing about 9.4% on September 2025 (Rs 1,228 billion). Over the first quarter of FY27 (July to September), collection reached about Rs 3,065 billion against a combined target of about Rs 3,053 billion, a small surplus after an August shortfall.
Building activity held up. Cement despatches totalled 4.62 million tons, 6.0% more than a year earlier, with domestic sales up 7.3% to 3.79 million tons and exports at 0.83 million tons. Factory output is weaker: large-scale manufacturing (LSM) grew just 0.7% year on year in August, the latest month available, and its three-month average is close to zero. GDP growth for the April to June quarter slowed to 2.0% from 4.4% the quarter before.
Broad money (M2) grew 12.1% year on year to Rs 46.4 trillion. After inflation, real money growth was about +1.8%, enough to keep activity ticking over but not a strong boost.
Leading indicators
Our dashboard tracks six leading indicators for Pakistan, each scored positive, neutral or negative. For September 2026 they read:
| Indicator | Reading | Signal |
|---|---|---|
| Consumer confidence | 36.6 (Sep) vs 12-month average 38.4 (-4.7%) | Neutral |
| Industrial output (LSM) | +0.7% YoY (Aug), 3-month average +0.1% | Neutral |
| Money supply (M2) | +12.1% YoY vs CPI 10.3%: real +1.8% | Neutral |
| Yield curve | 10Y PIB 12.5% minus policy 11.5% = +1.0 point (flat) | Neutral |
| Cement despatches | Domestic +7.3% YoY (Sep) | Positive |
| Currency valuation (REER) | 108.9 vs 10-year average 102.4: rupee overvalued | Negative |
That is one positive, four neutral and one negative, so the overall tilt is MIXED. Building activity is the only clear bright spot, and the expensive rupee is the main warning sign.
The model also places the economy in one of four regimes based on the direction of growth and inflation. For September it reads Disinflation: growth momentum is slowing (GDP growth down to 2.0%, LSM near flat) and the three-month average of inflation has eased from about 11.2% to 10.2%. In this regime the model leans toward defensive and rate-sensitive sectors over cyclical ones. This is the model’s reading of current data, not a forecast.
Sectors
Combining the Disinflation regime with the KSE-100 zone, which is currently Risk Off, the dashboard favours the defensive side: Banks, Oil & Gas, Fertilizer and Power, rather than growth sectors such as cement, autos, textiles, technology and engineering.
September’s price moves broadly fit that pattern. The KSE-100 fell 3.96%, from 176,976 to 169,969, and every sector group below lost ground, but the defensive groups lost the least:
| Sector group (stocks) | Side | Average return, Sep 2026 |
|---|---|---|
| Fertilizer (4) | Defensive | -0.1% |
| Oil & Gas (10) | Defensive | -3.2% |
| Technology (4) | Growth | -4.5% |
| Banks (14) | Defensive | -4.9% |
| Cement (10) | Growth | -5.7% |
| Textile (5) | Growth | -7.7% |
| Engineering & Steel (4) | Growth | -8.7% |
| Autos (7) | Growth | -8.9% |
| Power & Utilities (7) | Defensive | -9.0% |
Fertilizer was the steadiest group, helped by a 7.3% gain in EFERT. Power was the exception on the defensive side, dragged down by KEL (-15.9%) and the gas utilities. The weakest single names in the growth groups included GHNI (-17.1%) in autos.
Who was buying and selling. NCCPL data for the 22 trading days of September show mutual funds as the biggest net sellers at about Rs 11.8 billion, with foreign corporates selling a net Rs 6.25 billion and brokers’ own books Rs 2.47 billion. Local individuals absorbed most of it, buying a net Rs 10.3 billion, alongside companies (Rs 5.4 billion), overseas Pakistanis (Rs 1.4 billion) and banks (Rs 1.3 billion). By sector, foreign investors sold banks most heavily (about Rs 5.7 billion net) while individuals were the main buyers of banks, cement and exploration stocks. Our explainer on FIPI and LIPI shows how these investor flows move the KSE-100.
What to watch next month
- October inflation (due 3 November): early reports, including Business Recorder, put it at 9.6%, which would be only the second reading below 10% since March (July was 9.2%).
- October trade balance (due 6 November): whether the deficit stays near Rs 1 trillion with oil prices above $100.
- The effect of the 26 October rate rise to 12%: with inflation easing toward 9.6%, the real rate would widen to more than 2 points.
- Reserves: whether the Eurobond boost holds as debt repayments fall due.
- LSM for September and the REER for October, both due around mid-November.
Frequently asked questions
What was Pakistan’s inflation rate in September 2026?
Consumer price inflation was 10.3% year on year in September 2026, down from 11.1% in August. Prices still rose 1.3% within the month.
Why did Pakistan’s reserves jump in September 2026?
Total reserves rose by about $4.7 billion to $26.77 billion. News reports linked most of the increase to the arrival of Eurobond proceeds, which pushed the State Bank’s own reserves to a record of about $21.4 billion.
Did the FBR meet its tax target in September 2026?
Yes. The FBR collected Rs 1,344 billion against a target of Rs 1,343 billion, about 9.4% more than in September 2025.
What does a Disinflation regime mean for PSX sectors?
It means growth and inflation are both slowing. Our model then favours defensive and rate-sensitive sectors such as banks, oil and gas, fertilizer and power over cyclical ones. It describes the current data, not a guaranteed outcome.
Why did the KSE-100 fall in September 2026 despite better reserves?
Mutual funds and foreign corporates were heavy net sellers, the policy rate outlook was turning tighter, and oil prices climbed. Local individuals bought, but not enough to stop a 3.96% fall.
You can follow all of these indicators as they update on the Market Pulse Hub dashboard, and if you want early access to new tools, join the waitlist.
Bilal, Market Pulse Hub
Figures are from official releases, exchange data and our calculations up to 2 November 2026 and will change as new data arrives. This article is for education only and is not investment advice.