Learning how to read financial statements Pakistan companies publish every quarter is one of the most useful skills a stock investor can have. Results announcements can look like a wall of numbers, but you only need a handful of lines to understand what happened. This guide walks through a real example, the results of Indus Motor Company (INDU) for the quarter to 30 September 2026, line by line, using figures from the company’s report as read into our data up to 5 November 2026.
When and where PSX companies publish results
Under the Companies Act 2017, listed companies must publish first and third quarter accounts within 30 days of the quarter end and half-yearly accounts within 60 days, and the half-yearly accounts are subject to a limited scope review by the auditors, according to the SECP’s guide to company accounts. Annual audited accounts are laid before the annual general meeting, which must be held within 120 days of the year end. The PSX also requires companies to send their financial results to the exchange immediately after the board meeting that approves them, according to its guidance notes for listed companies (July 2023).
In practice you will see two documents. First comes a one-page results announcement on the PSX data portal (dps.psx.com.pk), usually on the day of the board meeting, with the key figures and any dividend. A few days later the full quarterly report follows, with the complete statements and notes. Indus Motor announced these results on 28 October 2026.
The three statements in brief
- Profit and loss account (income statement): sales, costs and profit for the period. This is where most investors start, and the focus of this guide.
- Balance sheet (statement of financial position): what the company owns and owes at the period end, including cash, debt and shareholders’ equity.
- Cash flow statement: the cash that actually came in and went out, split into operating, investing and financing activities. It shows whether profit is turning into cash.
Pakistani quarterly reports usually show two sets of figures: unconsolidated (the listed company alone) and consolidated (the company with its subsidiaries). For companies with large subsidiaries the two can differ a lot, so always check which one you are reading. Indus Motor’s figures below are from its quarterly report.
How to read financial statements Pakistan style: the Indus Motor example
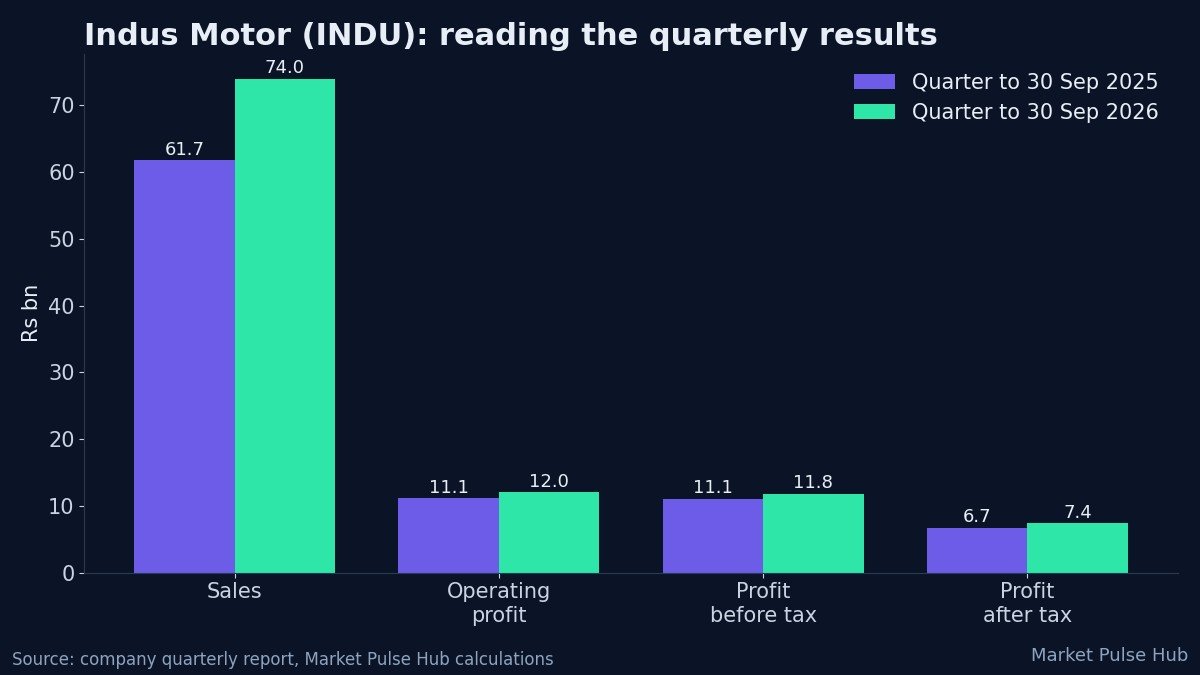
Indus Motor assembles and sells Toyota cars in Pakistan and has a June year end, so the quarter to 30 September 2026 is the first quarter of its 2027 financial year. The table puts this quarter next to the same quarter a year earlier, which is the right comparison for a seasonal business.
| Line | Quarter to 30 Sep 2026 | Quarter to 30 Sep 2025 | Change |
|---|---|---|---|
| Sales (net revenue) | Rs 74.01 bn | Rs 61.74 bn | +19.9% |
| Operating profit | Rs 12.04 bn | Rs 11.12 bn | +8.3% |
| Finance cost | Rs 204 M | about Rs 49 M | n/m |
| Profit before tax | Rs 11.84 bn | Rs 11.07 bn | +6.9% |
| Tax | Rs 4.45 bn | Rs 4.35 bn | +2.3% |
| Profit after tax | Rs 7.38 bn | Rs 6.72 bn | +9.9% |
| Earnings per share | Rs 93.95 | Rs 85.49 | +9.9% |
| Operating margin | 16.3% | 18.0% | -1.7 pts |
| Net margin | 10.0% | 10.9% | -0.9 pts |
| Effective tax rate | 37.6% | 39.3% | -1.7 pts |
Operating profit here is profit before tax plus finance cost, so it includes other income. Finance cost and tax are worked out from the reported lines (operating profit minus profit before tax, and profit before tax minus profit after tax). Margins are each line divided by sales. The change in finance cost is not shown because the year-earlier figure differs slightly between the company’s report and its results announcement, and both figures are small next to profit.
Line 1: sales
Sales are the money the company earned from selling its products, after sales tax and discounts. Indus Motor’s sales rose 19.9% to Rs 74.01 bn. The first question is always why: more cars sold, higher prices, or a change in the model mix. The directors’ review at the front of the report usually explains it.
Line 2: gross profit and operating profit
Gross profit is sales minus the direct cost of making the goods, such as parts, materials and factory wages. Gross margin (gross profit divided by sales) shows pricing power and cost pressure. Our extracted data does not include gross profit for this report, so check that line in the full report.
Operating profit takes away distribution and administrative costs as well. Indus Motor’s operating profit rose 8.3% to Rs 12.04 bn, slower than sales, so the operating margin fell from 18.0% to 16.3%. In plain words, the company sold more but kept a little less of each rupee. Our operating margin explainer covers this in more detail.
Line 3: other income and finance cost
In many reports, other income (often interest earned on cash) and finance cost (interest paid on borrowings) sit between operating profit and profit before tax, though layouts vary. In the table above, operating profit is measured as profit before tax plus finance cost, so other income is already included. Indus Motor has very little debt, and its finance cost was about Rs 204 M this quarter, tiny next to its profit. For a company with large loans, finance cost can swallow much of the operating profit, which is why it is worth checking every quarter, especially when interest rates change.
Line 4: tax and profit after tax
Profit before tax was Rs 11.84 bn and tax was Rs 4.45 bn, an effective rate of 37.6% against 39.3% a year earlier. Profit after tax, the bottom line that belongs to shareholders, rose 9.9% to Rs 7.38 bn. A very low tax rate can be a warning sign that profit rests on one-off tax benefits; a normal rate, as here, means the bottom line is easier to compare.
Line 5: earnings per share and the dividend
Earnings per share (EPS) is profit after tax divided by the number of shares. Indus Motor’s EPS rose to Rs 93.95 from Rs 85.49. EPS is the figure used for the P/E ratio (see EPS explained). With the results the company announced an interim cash dividend of Rs 56 a share (560% of the Rs 10 face value), with an ex-date of 5 November 2026. PSX companies often quote dividends as a percentage of face value, which is usually Rs 10, so a 100% dividend means Rs 10 a share.
Checks that go beyond the profit and loss account
Profit is only half the story. Our checks on Indus Motor flag that operating cash flow last year was negative and under half of net profit, which can happen when a carmaker’s customer advances or inventories swing. This is why it pays to read the cash flow statement too; our guide to the accruals ratio explains how to tell whether profit is backed by cash.
On the Market Pulse Hub dashboard, Indus Motor has a Pulse Score of 69.3 out of 100. The Pulse Score is our score that sums up a company’s growth, financial stability, valuation, working capital and cash flow from its reported results; it is an estimate, not a forecast. Our fair value estimate, blended from several valuation models such as discounted cash flow, is Rs 6,361 a share against a price of Rs 1,821.70 on 5 November 2026. That is a very wide gap; fair values are estimates that depend on the models’ assumptions, and the cash flow flag above is a reason to treat this one with caution. Our guide to reading a stock page explains each part.
A five-minute checklist for any results announcement
- Compare with the same period last year, not the previous quarter.
- Check whether the figures are consolidated or unconsolidated.
- See whether operating profit grew faster or slower than sales, and what happened to the margin.
- Look at finance cost, other income and the tax rate for anything unusual.
- Read the EPS and the dividend, and then check the cash flow statement.
- Read the directors’ review for the reasons behind the numbers.
Each results season we publish a weekly PSX results round-up, and every company’s figures are on the free Market Pulse Hub dashboard.
Frequently asked questions
Where can I find a PSX company’s quarterly results?
The results announcement and the full quarterly report are posted on the PSX data portal (dps.psx.com.pk) under each company’s announcements, and most companies also post them on their own websites.
How soon after the quarter end are results published?
Under the Companies Act 2017, first and third quarter accounts must be published within 30 days of the quarter end and half-yearly accounts within 60 days. Annual accounts are presented at the annual general meeting, which must be held within 120 days of the year end.
What is the difference between consolidated and unconsolidated results?
Unconsolidated results cover the listed company alone. Consolidated results add its subsidiaries. If a company owns large subsidiaries, the consolidated figures can be very different, so compare like with like.
Are quarterly results audited?
Quarterly accounts for the first and third quarters are not audited. Half-yearly accounts are subject to a limited scope review by the auditors, and annual accounts are fully audited.
What does a 560% dividend mean?
PSX dividends are often quoted as a percentage of the face value of a share. Indus Motor’s face value is Rs 10, so its 560% interim dividend is Rs 56 a share.
Practise on any company with the free Market Pulse Hub dashboard, and join the waitlist to get new tools and reports first.
Bilal, Market Pulse Hub
Figures are from company results, exchange data and our calculations up to 5 November 2026 and will change as new data arrives. This article is for education only and is not investment advice.