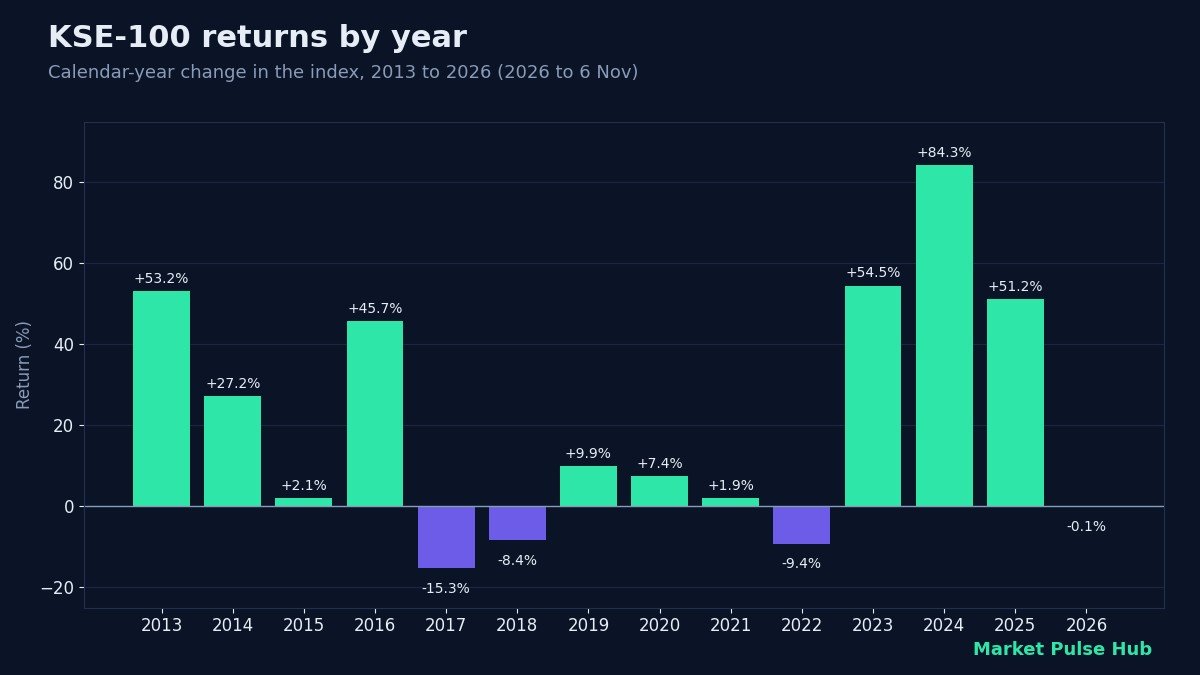
KSE-100 returns by year swing widely, from gains of more than 80% to losses of more than 15%. This article sets out the index’s calendar-year returns from 2013 to 6 November 2026, the biggest falls within each year and the years that set new all-time highs, all calculated from our daily closing data. It is a useful reality check for anyone planning to invest in Pakistan stocks for the long term.
What the KSE-100 index measures
The KSE-100 is the main index of the Pakistan Stock Exchange. According to the PSX KSE-100 index brochure (June 2025), it was introduced in November 1991 with a base value of 1,000 points. It holds 100 companies chosen on sector representation and free-float market capitalisation: the largest company in each sector is included first, and the remaining places go to the largest companies by free-float market value. The PSX indices page says the index represents about 85% of the exchange’s market capitalisation. The list is reviewed twice a year.
Our KSE-100 companies list shows every current member by sector and size.
KSE-100 returns by year since 2013
The table uses the closing level on the last trading day of each year. Our daily history starts on 2 January 2013, so the 2013 figure is measured from that day’s close of 16,490 rather than the end of 2012. The 2026 figure runs to 6 November 2026. “Biggest fall in the year” is the largest drop from a high to a later low within that year, using closing prices. “New record closes” counts the days the index closed above every earlier close in our data; the 2013 count is high because our data begins that year.
| Year | Start level | Year-end close | Return | Biggest fall in the year | New record closes |
|---|---|---|---|---|---|
| 2013 | 16,490 | 25,261 | +53.2% | -9.2% | 82 |
| 2014 | 25,261 | 32,131 | +27.2% | -8.9% | 42 |
| 2015 | 32,131 | 32,816 | +2.1% | -16.9% | 27 |
| 2016 | 32,816 | 47,807 | +45.7% | -8.0% | 64 |
| 2017 | 47,807 | 40,471 | -15.3% | -28.3% | 16 |
| 2018 | 40,471 | 37,067 | -8.4% | -21.4% | 0 |
| 2019 | 37,067 | 40,735 | +9.9% | -30.9% | 0 |
| 2020 | 40,735 | 43,755 | +7.4% | -37.0% | 0 |
| 2021 | 43,755 | 44,596 | +1.9% | -12.0% | 0 |
| 2022 | 44,596 | 40,420 | -9.4% | -15.7% | 0 |
| 2023 | 40,420 | 62,451 | +54.5% | -10.9% | 20 |
| 2024 | 62,451 | 115,127 | +84.3% | -8.5% | 71 |
| 2025 | 115,127 | 174,054 | +51.2% | -13.0% | 58 |
| 2026 (to 6 November 2026) | 174,054 | 173,887 | -0.1% | -22.6% | 8 |
Of the 13 full years from 2013 to 2025, the index rose in 10 and fell in 3. The average calendar-year return was 23.4% and the median 9.9%. The best year was 2024 at +84.3%, and the worst 2017 at -15.3%. These are price changes in rupees, before inflation, costs and tax.
Three very different periods
2013 to 2016: a long rise. The index more than doubled, from 16,490 at the start of 2013 to 47,807 at the end of 2016, with only one flat year in 2015 (+2.1%).
2017 to 2022: six hard years. After closing at 52,876 on 24 May 2017, the index did not close higher again until 3 November 2023. In between it fell 48.5% at its worst, to 27,229 on 25 March 2020, during the Covid-19 sell-off. It ended 2022 at 40,420, below the end-2016 level.
2023 to 2025: a record run. The index gained 54.5% in 2023, 84.3% in 2024 and 51.2% in 2025, setting 149 new record closes over the three years. It finished 2025 at 174,054.
2026 so far
The all-time closing high in our data is 189,167, set on 23 January 2026. By 6 November 2026 the index closed at 173,887, 8.1% below that high and down 0.1% for the year. The biggest fall within 2026 so far, measured on closing prices, was 22.6%. Our guide to SBP interest rates and stocks looks at how the policy rate has moved the market.
Points versus percentages
News reports often describe the KSE-100 in points, but points become less meaningful as the index rises. In 2024 the index gained 52,676 points, a +84.3% return. In 2013 it gained only 8,771 points, yet that was a +53.2% return. A 1,000-point move today is well under 1%, while in 2013 it was about 5%. Always compare years in percentage terms.
The biggest single-session moves
Daily swings show how quickly sentiment can change. The largest moves in a single trading session, compared with the close of the previous session, in our data since 2013 were:
| Date | Daily change | Points |
|---|---|---|
| 12 May 2025 | +9.45% | +10,123 |
| 8 April 2026 | +9.32% | +14,138 |
| 10 March 2026 | +6.62% | +9,697 |
| 2 March 2026 | -9.57% | -16,089 |
| 9 March 2026 | -6.99% | -11,016 |
| 24 March 2020 | -6.86% | -2,103 |
Big single days tend to come around major news such as budgets, interest rate decisions, IMF talks or global shocks. They are a reminder that anyone holding shares needs to be comfortable with sharp moves in both directions.
Long-run return and what it means for investors
From 16,490 on 2 January 2013 to 173,887 on 6 November 2026, the KSE-100 rose about 10.5 times, which works out to roughly 18.6% a year over 13.8 years. That average hides a lot: in 10 of the 14 years shown, the index fell 10% or more from a high at some point during the year.
- Time in the market matters. Someone who bought at the 2017 peak waited until 2023 just to see the index back at the same level.
- Big gains often follow bad years. The strongest run in the table came after a long period of falling and flat prices.
- Rupee returns are not real returns. Pakistan’s inflation and currency moves can take a large share of nominal gains, so compare returns with inflation and with safer options such as T-bills.
- Spreading purchases over time can reduce the risk of buying everything at a peak; our KSE-100 seasonality study looks at how returns vary by month.
You can follow the index, its sectors and investor flows every day on the Market Pulse Hub dashboard.
Frequently asked questions
What was the KSE-100 return in 2025?
Using closing levels from our data, the KSE-100 rose 51.2% in 2025, from 115,127 to 174,054.
What is the best year in KSE-100 history since 2013?
Between 2013 and 2025, the best calendar year was 2024, when the index rose 84.3%. The worst was 2017 at -15.3%.
What is the KSE-100 all-time high?
The highest close in our data is 189,167, on 23 January 2026. On 6 November 2026 the index closed at 173,887.
What is the average yearly return of the KSE-100?
From 2 January 2013 to 6 November 2026, the index grew at about 18.6% a year in rupee terms. The simple average of full calendar years from 2013 to 2025 was 23.4%. Both figures exclude costs, tax and inflation, and past returns do not predict future ones.
What was the biggest KSE-100 crash in recent years?
In our data, the deepest fall from a high was 48.5%, from 52,876 on 24 May 2017 to 27,229 on 25 March 2020.
When did the KSE-100 start?
According to PSX, the KSE-100 index was introduced in November 1991 with a base value of 1,000 points.
Want alerts when scores, fair values and results change? Join the Market Pulse Hub waitlist.
Bilal, Market Pulse Hub
Figures are from company results, exchange data and our calculations up to 6 November 2026 and will change as new data arrives. This article is for education only and is not investment advice.