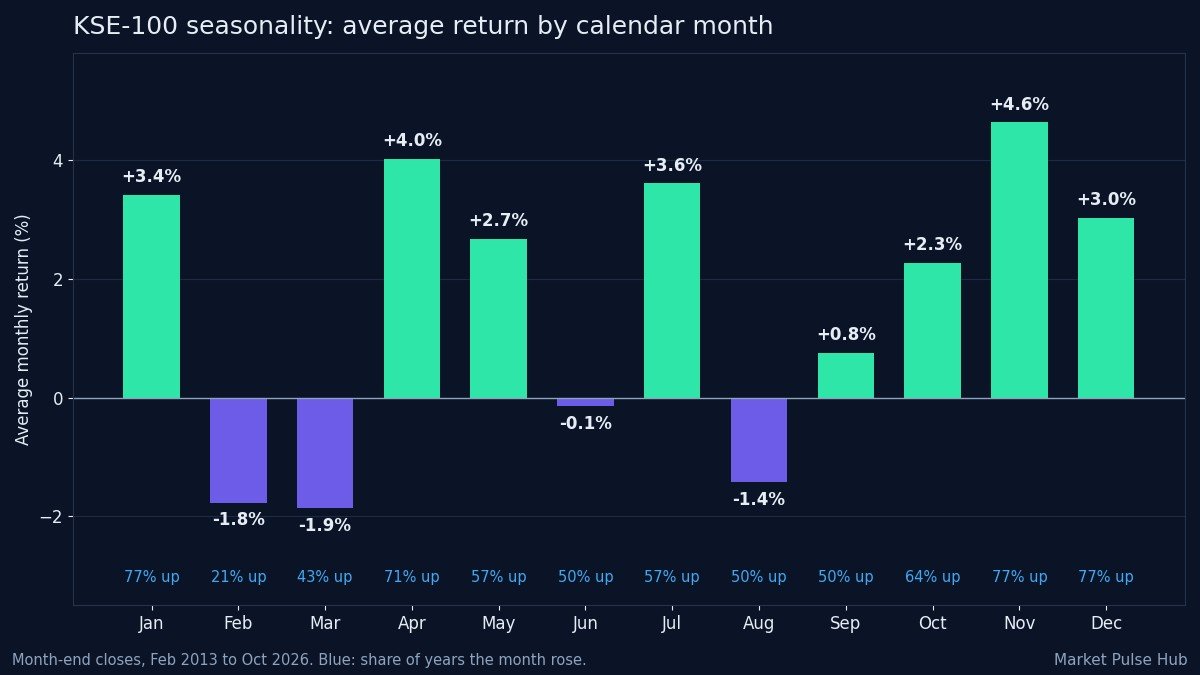
Is there a best month to invest PSX shares in, or a month to avoid? Many Pakistani investors have heard that the KSE-100 does well around the end of the year and struggles in late winter. This guide tests that idea with 165 months of KSE-100 index data, from February 2013 to October 2026, and shows the average return, the median return and how often each calendar month has ended higher. Index levels are up to 4 November 2026.
What seasonality means for stock investors
Seasonality is the tendency of a market to behave differently at certain times of the year. In some markets it comes from regular events: company results, dividend payments, tax deadlines, budgets or the flow of new money at the start of a year. Looking at seasonality is a way to ask whether the calendar has carried any useful information in the past.
It is important to be clear about what this kind of study can and cannot tell you. It describes the past. With only 13 or 14 examples of each month in our data, a single extreme month can move an average a long way, and patterns can change as the economy, interest rates and the investor base change. Seasonality is best used as background, not as a timing rule.
How we measured it
We took the closing level of the KSE-100 on the last trading day of each month from our daily index file, which starts on 2 January 2013. The return for a month is the change from one month-end close to the next. That gives 165 complete months, from February 2013 to October 2026. January, November and December have 13 years of data each; the other months have 14.
For each calendar month we show the average return, the median return (the middle value, which is less affected by one extreme year) and the number of years in which the index ended the month higher. Across all 165 months the KSE-100 rose in 57.6% of months, with an average monthly change of 1.56% and a median of 1.45%.
Best month to invest PSX: the month-by-month table
| Month | Years | Average return | Median return | Years up | Best | Worst |
|---|---|---|---|---|---|---|
| January | 13 | 3.41% | 2.20% | 10 of 13 (77%) | +10.1% (2019) | -4.6% (2016) |
| February | 14 | -1.77% | -1.48% | 3 of 14 (21%) | +5.4% (2013) | -8.8% (2020) |
| March | 14 | -1.86% | -0.75% | 6 of 14 (43%) | +5.6% (2016) | -23.0% (2020) |
| April | 14 | 4.02% | 4.36% | 10 of 14 (71%) | +16.7% (2020) | -5.5% (2025) |
| May | 14 | 2.68% | 2.74% | 8 of 14 (57%) | +15.0% (2013) | -5.8% (2018) |
| June | 14 | -0.15% | 0.00% | 7 of 14 (50%) | +5.0% (2025) | -8.0% (2017) |
| July | 14 | 3.61% | 2.07% | 8 of 14 (57%) | +15.9% (2023) | -5.8% (2019) |
| August | 14 | -1.43% | -0.89% | 7 of 14 (50%) | +6.6% (2025) | -10.4% (2017) |
| September | 14 | 0.75% | 0.27% | 7 of 14 (50%) | +11.4% (2025) | -7.0% (2015) |
| October | 14 | 2.27% | 1.89% | 9 of 14 (64%) | +12.3% (2023) | -6.6% (2017) |
| November | 13 | 4.64% | 2.96% | 10 of 13 (77%) | +16.6% (2023) | -5.9% (2015) |
| December | 13 | 3.02% | 3.17% | 10 of 13 (77%) | +13.6% (2024) | -8.5% (2018) |
Returns are changes in the KSE-100 index from one month-end close to the next, from February 2013 to October 2026. Best and worst show the single largest rise and fall for that month, with the year.
The strongest months
November has the highest average in our data, at 4.64%, and the index rose in 10 of the 13 Novembers. Its median of 2.96% is lower than the average, because a few very large months, such as a rise of 16.6% in November 2023, pull the average up. December (average 3.02%, up in 10 of 13 years) and January (average 3.41%, up in 10 of 13 years) have also been strong, which is why people talk about a year-end rally on the PSX.
April is the other standout, with an average of 4.02%, a median of 4.36% and gains in 10 of 14 years. Its best month was April 2020, when the index rose 16.7% after the March 2020 crash. July has an average of 3.61%, but it rose in only 8 of 14 years, so its high average depends heavily on big months such as July 2023, up 15.9%.
The weakest months
February is the clearest weak month. The index rose in only 3 of the 14 Februaries in our data, and the average change was a fall of 1.77%. March has a similar average, a fall of 1.86%, but that figure is dominated by March 2020, when the KSE-100 fell 23.0% as the pandemic hit, and by a fall of 11.5% in March 2026. Its median, a fall of 0.75%, is milder.
August (average fall of 1.43%, up in 7 of 14 years) and June (close to flat on average, up in 7 of 14 years) have also been weaker than the rest of the year. August’s average is pulled down by a fall of 10.4% in August 2017.
Does the pattern hold over time?
One way to test a seasonal pattern is to split the data into two periods and see whether each month behaves the same way in both. The table below compares 2013 to 2019 with 2020 to 2026.
| Month | Average 2013 to 2019 | Average 2020 to 2026 |
|---|---|---|
| January | 4.9% | 2.1% |
| February | -1.0% | -2.5% |
| March | 0.5% | -4.2% |
| April | 3.6% | 4.4% |
| May | 2.0% | 3.3% |
| June | -1.6% | 1.3% |
| July | 2.4% | 4.8% |
| August | -4.7% | 1.8% |
| September | 0.9% | 0.6% |
| October | 1.8% | 2.7% |
| November | 3.4% | 6.1% |
| December | 2.5% | 3.7% |
Some patterns appear in both periods. February was negative on average in both halves, and November, December, January and April were positive in both. Other months changed character. August averaged a fall of 4.65% in the earlier period but a rise of 1.79% in the later one, and March swung from a small gain to an average fall of 4.25%. That is a reminder that a few big events, not the calendar itself, often drive these averages.
Why the calendar may matter on the PSX
There is no single proven cause for these patterns, but several regular events in Pakistan’s market calendar are worth knowing about:
- Results and dividend season: many large companies close their books in December or June, and their annual results and dividend announcements arrive in the following weeks. Our weekly results round-ups show how busy these periods can be.
- Interest rate decisions: changes in the State Bank of Pakistan policy rate shift money between bank deposits, bonds and shares. See how SBP interest rate changes move the KSE-100.
- Budget and policy news: tax changes announced around the federal budget can affect sentiment towards particular sectors.
- Investor flows: foreign and local investor groups often rebalance around year ends. Our guide to FIPI and LIPI flows explains how to follow them.
Calendar years matter more than calendar months
The difference between a strong and a weak month in our table is a few percentage points. The difference between good and bad years is far bigger. The KSE-100 rose 84.3% in 2024, 54.5% in 2023 and 51.2% in 2025, but fell 15.3% in 2017 and 9.4% in 2022. On 4 November 2026 the index stood at 172,013, a fall of 1.2% since the end of 2025 and a rise of 3.4% since the end of October 2026.
For a long-term investor, how long money stays invested and what it is invested in usually matters much more than which month it goes in. Spreading purchases over time, for example by investing a fixed amount each month, avoids betting everything on one month. You can see how interest rates feed into the stock and bond mix with the KSE Allocation guide, and new investors can start with our step-by-step guide to investing in PSX.
Frequently asked questions
Which month has been best for the KSE-100?
From February 2013 to October 2026, November had the highest average return at 4.64%, followed by April at 4.02%. April had the highest median return at 4.36%. Past patterns may not repeat.
Which month has been worst for the PSX?
February has been the weakest month by consistency: the KSE-100 rose in only 3 of 14 Februaries, with an average fall of 1.77%. March had a similar average fall, but mostly because of the crash in March 2020.
Is there a year-end rally on the PSX?
November, December and January each rose in 10 of 13 years in our data, with average gains of 4.64%, 3.02% and 3.41%. That supports the idea of a strong end of year, but there were also years when these months fell.
Should I wait for a certain month to invest?
Seasonal averages are based on only 13 or 14 years per month and are heavily affected by a few big events. Many investors prefer to invest regularly instead of trying to time the calendar. This article is for education only and is not a recommendation.
Where does this data come from?
We used daily closing levels of the KSE-100 index from our market data, taking the last close of each month from February 2013 to October 2026. The latest close used in this article is from 4 November 2026.
Use the free Market Pulse Hub dashboard to check these numbers yourself, and join the waitlist to get new tools and reports first.
Bilal, Market Pulse Hub
Figures are from company results, exchange data and our calculations up to 4 November 2026 and will change as new data arrives. This article is for education only and is not investment advice.