Looking for a complete KSE-100 companies list? This page lists every member of the KSE-100, the Pakistan Stock Exchange’s benchmark index, grouped by sector, with its share price, market value, weight in the index, P/E ratio and dividend yield. All prices are closing prices on 30 October 2026, when the KSE-100 closed at 166,409.25, -0.47% on the day.
What the KSE-100 is
The KSE-100 tracks 100 of the largest and most traded companies listed on the PSX. When people say “the market was up today” in Pakistan, they usually mean this index. Each company counts in the index according to its weight, so a 1% move in a heavyweight bank or fertilizer company moves the index far more than a 1% move in a small textile mill. The weights below are the ones shown in PSX index data on 30 October 2026.
Membership changes from time to time, so check the current list on the PSX data portal or the Market Pulse Hub dashboard before relying on membership for an investment decision.
KSE-100 at a glance
- Combined market value: about Rs 15.4 trillion for the 99 members we have share data for. The largest by market value is Oil & Gas Development Company at Rs 1,319.4 bn.
- Concentration: the 10 heaviest companies make up 49.7% of the index.
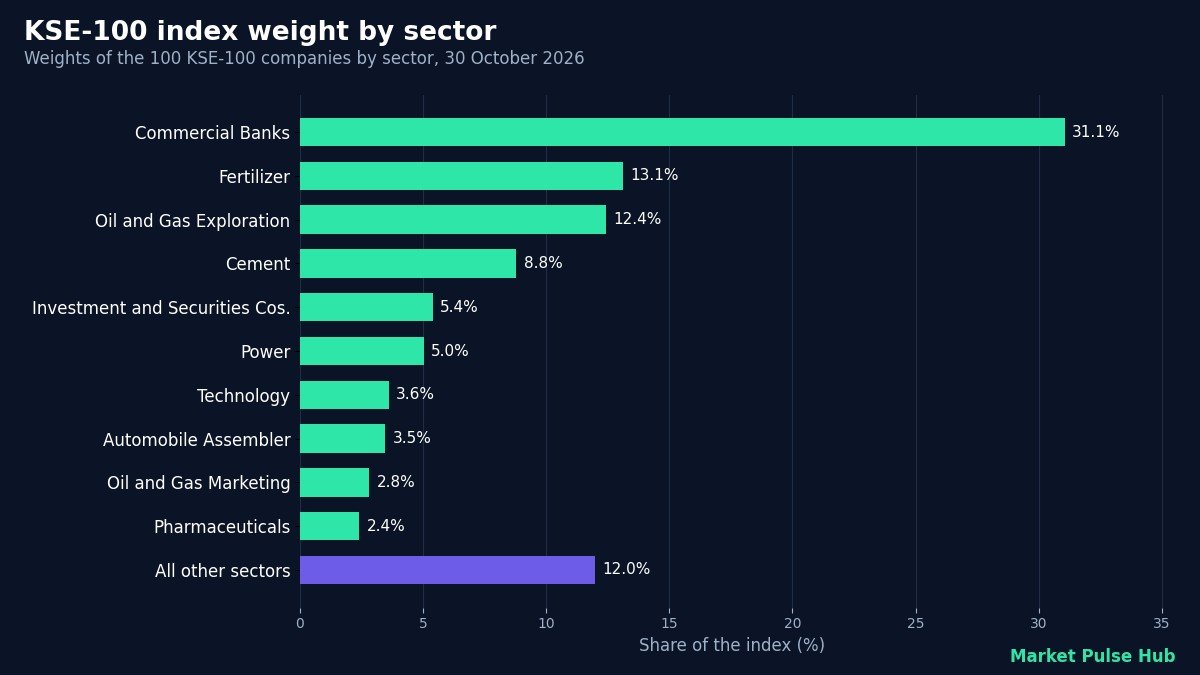
- Sectors: 35 sectors are represented. Commercial Banks is the heaviest with 14 companies and 31.1% of the index, followed by Fertilizer (13.1%) and Oil & Gas Exploration (12.4%).
- Valuation: the median P/E of members with positive earnings is 7.0, and the median dividend yield of members that paid a dividend in the last 12 months is 5.4%.
- Shariah screening: 27 members are also in the KMI-30 Shariah index. Our KMI-30 stocks list covers those in detail.
The 10 heaviest companies in the KSE-100
These ten companies carry the most weight, so they explain most of the index’s daily moves.
| # | Stock | Company | Sector | Index weight | Price (Rs) | Market value (Rs bn) |
|---|---|---|---|---|---|---|
| 1 | FFC | Fauji Fertilizer Company | Fertilizer | 9.5% | 559.49 | 805.1 |
| 2 | UBL | United Bank | Commercial Banks | 7.7% | 409.68 | 1,025.9 |
| 3 | MEBL | Meezan Bank | Commercial Banks | 5.1% | 528.61 | 955.2 |
| 4 | ENGROH | Engro Holdings | Investment & Securities Cos. | 5.0% | 256.34 | 308.7 |
| 5 | OGDC | Oil & Gas Development Company | Oil & Gas Exploration | 4.2% | 306.78 | 1,319.4 |
| 6 | HUBC | The Hub Power Company | Power | 4.0% | 193.18 | 250.6 |
| 7 | LUCK | Lucky Cement | Cement | 3.7% | 391.38 | 573.4 |
| 8 | HBL | Habib Bank | Commercial Banks | 3.7% | 291.55 | 427.7 |
| 9 | MCB | MCB Bank | Commercial Banks | 3.5% | 397.52 | 471.1 |
| 10 | MARI | Mari Energies | Oil & Gas Exploration | 3.2% | 631.53 | 758.2 |
KSE-100 by sector
Market value here is the full value of each company (share price times all shares), added up by sector. Index weight can differ from a sector’s share of market value, because PSX index data weights each company by its free-float figure (the shares available for trading) rather than by all of its shares.
| Sector | Companies | Index weight | Market value (Rs bn) |
|---|---|---|---|
| Commercial Banks | 14 | 31.1% | 4,545.2 |
| Fertilizer | 4 | 13.1% | 1,402.5 |
| Oil & Gas Exploration | 4 | 12.4% | 2,849.1 |
| Cement | 10 | 8.8% | 1,405.3 |
| Investment & Securities Cos. | 2 | 5.4% | 341.2 |
| Power | 5 | 5.0% | 468.3 |
| Technology | 4 | 3.6% | 410.4 |
| Automobile Assembler | 7 | 3.5% | 653.5 |
| Oil & Gas Marketing | 4 | 2.8% | 312.6 |
| Pharmaceuticals | 7 | 2.4% | 421.0 |
| Food & Personal Care | 6 | 2.3% | 902.6 |
| Refinery | 2 | 1.4% | 191.0 |
| Textile Composite | 3 | 1.2% | 230.2 |
| Miscellaneous | 2 | 0.9% | 59.4 |
| REIT | 2 | 0.8% | 103.7 |
| Leather & Tanneries | 1 | 0.8% | 79.4 |
| Chemical | 2 | 0.6% | 119.3 |
| Glass & Ceramics | 2 | 0.5% | 66.9 |
| Property | 1 | 0.5% | 48.7 |
| Insurance | 1 | 0.4% | 33.2 |
| Engineering | 2 | 0.4% | 52.7 |
| Tobacco | 1 | 0.4% | 378.9 |
| Cable & Electrical Goods | 1 | 0.3% | 29.9 |
| Auto Parts | 1 | 0.3% | 40.5 |
| Transport | 1 | 0.2% | 23.1 |
| Paper & Packaging | 1 | 0.2% | 55.8 |
| Sugar | 1 | 0.2% | 51.2 |
| Synthetic & Rayon | 1 | 0.1% | 76.1 |
| n/a | 1 | 0.1% | n/a |
| Apparel | 1 | 0.1% | 5.3 |
| Modarabas | 1 | 0.1% | 3.0 |
| Textile Spinning | 1 | 0.1% | 8.2 |
| Woollen | 1 | 0.0% | 0.6 |
| Vanaspati | 1 | 0.0% | 2.3 |
| Textile Weaving | 1 | 0.0% | 0.8 |
| Leasing Companies | 1 | 0.0% | 0.6 |
Banks dominate, which is why bank results and changes in interest rates tend to move the whole index. Our comparison of PSX bank stocks looks at that sector in depth. Oil and gas exploration companies make up 18.5% of the members’ combined market value but only 12.4% of the index weight, a sign that a smaller share of their stock is freely traded.
What stands out in the biggest sectors
Commercial Banks
14 companies with 31.1% of the index. The heaviest is United Bank (UBL) at 7.7%. The median P/E of members with positive earnings is 6.0 and the median dividend yield of those that paid a dividend is 9.5%. 1 of the 14 has no cash dividend in the last 12 months or no dividend data.
Fertilizer
4 companies with 13.1% of the index. The heaviest is Fauji Fertilizer Company (FFC) at 9.5%. The median P/E of members with positive earnings is 7.7 and the median dividend yield of those that paid a dividend is 7.3%.
Oil & Gas Exploration
4 companies with 12.4% of the index. The heaviest is Oil & Gas Development Company (OGDC) at 4.2%. The median P/E of members with positive earnings is 5.4 and the median dividend yield of those that paid a dividend is 5.6%.
Cement
10 companies with 8.8% of the index. The heaviest is Lucky Cement (LUCK) at 3.7%. The median P/E of members with positive earnings is 7.2 and the median dividend yield of those that paid a dividend is 2.1%. 5 of the 10 have no cash dividend in the last 12 months or no dividend data.
Investment & Securities Cos.
2 companies with 5.4% of the index. The heaviest is Engro Holdings (ENGROH) at 5.0%. The median P/E of members with positive earnings is 11.1 and the median dividend yield of those that paid a dividend is 2.4%. 1 of the 2 has no cash dividend in the last 12 months or no dividend data.
Power
5 companies with 5.0% of the index. The heaviest is The Hub Power Company (HUBC) at 4.0%. The median P/E of members with positive earnings is 7.2 and the median dividend yield of those that paid a dividend is 7.7%. 1 of the 5 has no cash dividend in the last 12 months or no dividend data.
Full KSE-100 companies list with price, P/E and dividend yield
Companies are grouped by sector, heaviest sector first, and sorted by index weight within each sector. P/E is the share price divided by the last 12 months’ earnings per share; “n/a” means the company made a loss or we have no reliable earnings figure. Dividend yield is cash dividends paid over the last 12 months divided by the share price; “n/a” means no dividend in that period or no data. HBL Growth Fund is a fund rather than an operating company, so we do not score it.
| Stock | Company | Sector | Price (Rs) | Market value (Rs bn) | Index weight | P/E | Dividend yield |
|---|---|---|---|---|---|---|---|
| UBL | United Bank | Commercial Banks | 409.68 | 1,025.9 | 7.71% | 7.0 | 7.8% |
| MEBL | Meezan Bank | Commercial Banks | 528.61 | 955.2 | 5.12% | 10.1 | 5.8% |
| HBL | Habib Bank | Commercial Banks | 291.55 | 427.7 | 3.67% | 6.2 | 8.4% |
| MCB | MCB Bank | Commercial Banks | 397.52 | 471.1 | 3.54% | 8.1 | 9.4% |
| BAHL | Bank AL Habib | Commercial Banks | 150.89 | 167.7 | 2.70% | 5.6 | 10.0% |
| BAFL | Bank Alfalah | Commercial Banks | 57.77 | 182.2 | 1.76% | 5.1 | 13.3% |
| NBP | National Bank of Pakistan | Commercial Banks | 159.72 | 339.8 | 1.75% | 5.0 | 22.6% |
| FABL | Faysal Bank | Commercial Banks | 91.40 | 138.7 | 1.04% | 6.1 | 7.2% |
| AKBL | Askari Bank | Commercial Banks | 107.99 | 156.5 | 1.01% | 6.2 | 7.3% |
| HMB | Habib Metropolitan Bank | Commercial Banks | 96.68 | 101.3 | 0.98% | 5.3 | 12.5% |
| BOP | The Bank of Punjab | Commercial Banks | 28.35 | 92.7 | 0.84% | 5.1 | 11.3% |
| ABL | Allied Bank | Commercial Banks | 170.89 | 195.7 | 0.42% | 6.0 | 9.5% |
| BML | Bank Makramah | Commercial Banks | 58.33 | 60.0 | 0.26% | n/a | n/a |
| SCBPL | Standard Chartered Bank (Pak) | Commercial Banks | 59.57 | 230.6 | 0.25% | 9.6 | 10.0% |
| FFC | Fauji Fertilizer Company | Fertilizer | 559.49 | 805.1 | 9.50% | 8.8 | 7.6% |
| EFERT | Engro Fertilizers | Fertilizer | 194.99 | 260.4 | 2.51% | 10.6 | 6.9% |
| FATIMA | Fatima Fertilizer Company | Fertilizer | 134.56 | 282.6 | 0.91% | 6.6 | 4.5% |
| AHCL | Arif Habib Corporation | Fertilizer | 12.92 | 54.5 | 0.18% | 3.9 | 9.5% |
| OGDC | Oil & Gas Development Company | Oil & Gas Exploration | 306.78 | 1,319.4 | 4.25% | 5.0 | 5.6% |
| MARI | Mari Energies | Oil & Gas Exploration | 631.53 | 758.2 | 3.25% | 8.2 | 4.3% |
| PPL | Pakistan Petroleum | Oil & Gas Exploration | 213.93 | 582.1 | 3.07% | 5.7 | 5.6% |
| POL | Pakistan Oilfields | Oil & Gas Exploration | 667.04 | 189.3 | 1.86% | 5.2 | 15.0% |
| LUCK | Lucky Cement | Cement | 391.38 | 573.4 | 3.69% | 6.5 | 1.3% |
| FCCL | Fauji Cement Company | Cement | 52.28 | 128.2 | 0.96% | 7.2 | 2.9% |
| MLCF | Maple Leaf Cement Factory | Cement | 90.51 | 94.8 | 0.92% | 7.4 | n/a |
| DGKC | D.G. Khan Cement Company | Cement | 178.15 | 78.1 | 0.84% | 6.4 | 0.6% |
| CHCC | Cherat Cement Company | Cement | 267.53 | 52.0 | 0.67% | 7.0 | 2.1% |
| BWCL | Bestway Cement | Cement | 473.30 | 282.2 | 0.61% | 11.0 | 8.6% |
| KOHC | Kohat Cement Company | Cement | 86.16 | 79.2 | 0.42% | 7.2 | n/a |
| THCCL | Thatta Cement Company | Cement | 73.97 | 36.9 | 0.28% | 10.2 | n/a |
| POWER | Power Cement | Cement | 21.39 | 27.6 | 0.21% | 7.4 | n/a |
| PIOC | Pioneer Cement | Cement | 233.14 | 53.0 | 0.17% | 7.0 | n/a |
| ENGROH | Engro Holdings | Investment & Securities Cos. | 256.34 | 308.7 | 4.97% | 7.1 | n/a |
| PSX | Pakistan Stock Exchange | Investment & Securities Cos. | 40.59 | 32.5 | 0.42% | 15.2 | 2.4% |
| HUBC | The Hub Power Company | Power | 193.18 | 250.6 | 4.03% | 4.9 | 10.6% |
| KEL | K-Electric | Power | 5.79 | 159.9 | 0.34% | n/a | n/a |
| KAPCO | Kot Addu Power Company | Power | 24.17 | 21.3 | 0.24% | 7.1 | 12.5% |
| NCPL | Nishat Chunian Power | Power | 49.60 | 18.2 | 0.22% | 7.3 | 4.8% |
| NPL | Nishat Power | Power | 51.80 | 18.3 | 0.19% | 7.5 | 4.5% |
| SYS | Systems | Technology | 109.15 | 167.1 | 2.33% | 13.7 | 1.8% |
| PTC | Pakistan Telecommunication Company | Technology | 45.19 | 170.5 | 0.58% | 37.8 | n/a |
| TRG | TRG Pakistan | Technology | 51.96 | 28.3 | 0.40% | n/a | n/a |
| AIRLINK | Air Link Communication | Technology | 112.37 | 44.4 | 0.29% | 7.8 | 1.7% |
| MTL | Millat Tractors | Automobile Assembler | 280.10 | 111.8 | 1.08% | 13.5 | 7.5% |
| SAZEW | Sazgar Engineering Works | Automobile Assembler | 1,400.25 | 84.6 | 0.64% | 3.6 | 4.3% |
| INDU | Indus Motor Company | Automobile Assembler | 1,858.20 | 146.1 | 0.56% | 5.6 | 10.9% |
| ATLH | Atlas Honda | Automobile Assembler | 1,652.81 | 205.1 | 0.44% | 8.9 | 6.5% |
| GHNI | Ghandhara Industries | Automobile Assembler | 1,151.44 | 49.1 | 0.37% | 6.2 | 1.1% |
| GAL | Ghandhara Automobiles | Automobile Assembler | 501.41 | 28.6 | 0.25% | 3.9 | 2.3% |
| HCAR | Honda Atlas Cars | Automobile Assembler | 198.38 | 28.3 | 0.12% | 5.8 | 4.5% |
| PSO | Pakistan State Oil Company | Oil & Gas Marketing | 355.44 | 166.9 | 1.79% | 3.8 | 2.8% |
| SNGP | Sui Northern Gas Pipelines | Oil & Gas Marketing | 90.53 | 57.4 | 0.49% | 3.9 | 3.3% |
| APL | Attock Petroleum | Oil & Gas Marketing | 549.94 | 68.4 | 0.37% | 3.5 | 11.3% |
| SSGC | Sui Southern Gas Company | Oil & Gas Marketing | 22.53 | 19.8 | 0.16% | n/a | 2.2% |
| SEARL | The Searle Company | Pharmaceuticals | 73.77 | 43.4 | 0.47% | 63.3 | 1.3% |
| ABOT | Abbott Laboratories | Pharmaceuticals | 966.69 | 94.6 | 0.44% | 10.2 | 4.1% |
| GLAXO | GlaxoSmithKline Pakistan | Pharmaceuticals | 319.39 | 101.7 | 0.44% | 9.3 | 6.0% |
| HINOON | Highnoon Laboratories | Pharmaceuticals | 920.51 | 48.8 | 0.42% | 11.7 | 5.4% |
| AGP | AGP | Pharmaceuticals | 148.12 | 41.5 | 0.27% | 11.7 | 5.3% |
| HALEON | Haleon Pakistan | Pharmaceuticals | 658.80 | 77.1 | 0.22% | 11.8 | 4.5% |
| CPHL | Citi Pharma | Pharmaceuticals | 60.74 | 13.9 | 0.15% | 17.6 | n/a |
| NESTLE | Nestle Pakistan | Food & Personal Care | 7,045.00 | 319.5 | 0.69% | 18.1 | 8.0% |
| COLG | Colgate-Palmolive | Food & Personal Care | 1,179.42 | 286.3 | 0.61% | 15.1 | 5.6% |
| NATF | National Foods | Food & Personal Care | 309.05 | 72.0 | 0.39% | 2.8 | 4.8% |
| UPFL | Unilever Pakistan Foods | Food & Personal Care | 26,280.00 | 167.4 | 0.29% | 21.7 | 4.7% |
| MUREB | Murree Brewery Company | Food & Personal Care | 898.95 | 24.9 | 0.21% | 6.2 | 4.8% |
| FFL | Fauji Foods | Food & Personal Care | 12.90 | 32.5 | 0.14% | 37.4 | n/a |
| ATRL | Attock Refinery | Refinery | 1,088.78 | 116.1 | 1.00% | 2.7 | 1.6% |
| CNERGY | Cnergyico PK | Refinery | 13.64 | 74.9 | 0.40% | 3.0 | n/a |
| ILP | Interloop | Textile Composite | 96.37 | 135.1 | 0.58% | 9.5 | 4.4% |
| NML | Nishat Mills | Textile Composite | 123.00 | 43.2 | 0.42% | 2.8 | 1.6% |
| KTML | Kohinoor Textile Mills | Textile Composite | 38.49 | 51.8 | 0.22% | 5.5 | n/a |
| PSEL | Pakistan Services | Miscellaneous | 985.19 | 32.0 | 0.65% | n/a | n/a |
| SHFA | Shifa International Hospitals | Miscellaneous | 432.80 | 27.4 | 0.26% | 11.5 | 1.1% |
| DCR | Dolmen City REIT | REIT | 39.44 | 87.7 | 0.47% | n/a | n/a |
| TPLRF1 | TPL REIT Fund I | REIT | 8.74 | 16.0 | 0.31% | n/a | n/a |
| SRVI | Service Industries | Leather & Tanneries | 168.97 | 79.4 | 0.77% | 3.7 | 1.0% |
| LCI | Lucky Core Industries | Chemical | 179.99 | 83.1 | 0.36% | 9.0 | 5.7% |
| LOTCHEM | Lotte Chemical Pakistan | Chemical | 23.89 | 36.2 | 0.19% | 7.0 | 21.8% |
| GHGL | Ghani Glass | Glass & Ceramics | 37.54 | 37.5 | 0.28% | 4.9 | 9.1% |
| TGL | Tariq Glass Industries | Glass & Ceramics | 170.44 | 29.3 | 0.25% | 6.3 | 3.2% |
| JVDC | Javedan Corporation | Property | 127.78 | 48.7 | 0.52% | 12.6 | 4.7% |
| AICL | Adamjee Insurance Company | Insurance | 94.74 | 33.2 | 0.43% | 5.8 | 5.3% |
| ISL | International Steels | Engineering | 77.43 | 33.7 | 0.25% | 6.4 | 6.7% |
| INIL | International Industries | Engineering | 144.33 | 19.0 | 0.18% | 4.5 | 4.5% |
| PAKT | Pakistan Tobacco Company | Tobacco | 1,482.91 | 378.9 | 0.40% | 11.1 | 10.5% |
| PAEL | Pak Elektron | Cable & Electrical Goods | 32.33 | 29.9 | 0.35% | 7.2 | n/a |
| THALL | Thal | Auto Parts | 500.00 | 40.5 | 0.35% | 3.6 | 6.1% |
| PIBTL | Pakistan International Bulk Terminal | Transport | 12.93 | 23.1 | 0.25% | 6.5 | n/a |
| PKGS | Packages | Paper & Packaging | 624.70 | 55.8 | 0.24% | 19.8 | 2.4% |
| JDWS | JDW Sugar Mills | Sugar | 886.31 | 51.2 | 0.16% | 5.5 | n/a |
| IBFL | Ibrahim Fibres | Synthetic & Rayon | 245.02 | 76.1 | 0.08% | n/a | n/a |
| HGFA | HBL Growth Fund | n/a | 13.00 | n/a | 0.07% | n/a | n/a |
| IMAGE | Image Pakistan | Apparel | 22.83 | 5.3 | 0.07% | 8.0 | 4.2% |
| FHAM | First Habib Modaraba | Modarabas | 27.50 | 3.0 | 0.06% | 4.0 | 8.3% |
| GADT | Gadoon Textile Mills | Textile Spinning | 292.61 | 8.2 | 0.05% | 2.6 | 1.9% |
| BNWM | Bannu Woollen Mills | Woollen | 59.40 | 0.6 | 0.01% | n/a | n/a |
| SSOM | S.S.Oil Mills | Vanaspati | 406.52 | 2.3 | 0.01% | n/a | n/a |
| YOUW | Yousaf Weaving Mills | Textile Weaving | 4.50 | 0.8 | 0.01% | n/a | n/a |
| PGLC | Pak-Gulf Leasing Company | Leasing Companies | 12.86 | 0.6 | 0.00% | n/a | n/a |
How to use this list
- Know what moves the index. With 49.7% of the weight in ten names, the KSE-100 can rise while most of its members fall, or the other way round.
- Compare within a sector. A P/E of 6 means something different for a bank than for a pharmaceutical company. Our P/E ratio explainer shows how to read that number.
- Look beyond the index. Membership means a company is large and traded, not that it is good value or high quality. Each stock page on the dashboard shows its Pulse Score, our measure of financial quality, scored out of 100, and its fair value, our model estimate of what one share is worth.
Frequently asked questions
How many companies are in the KSE-100?
The KSE-100 has 100 members. On 30 October 2026 they came from 35 sectors, with Commercial Banks the largest group at 14 companies.
Which company has the biggest weight in the KSE-100?
On 30 October 2026, Fauji Fertilizer Company (FFC) had the largest weight at 9.5%, followed by United Bank at 7.7% and Meezan Bank at 5.1%.
Which sector is the largest in the KSE-100?
Commercial Banks. The 14 banks in the index made up 31.1% of its weight on 30 October 2026.
Can I invest in the whole KSE-100 at once?
You can buy shares of individual members through a licensed broker. Some funds follow index-based strategies, so if you prefer a fund, check its documents to see which index it follows and what it costs. Our beginner’s guide to investing on the PSX explains how to open an account.
How often does the KSE-100 list change?
Membership changes from time to time, and PSX publishes the current constituents. Prices, weights and ratios also change every trading day, so the figures here are a snapshot as of 30 October 2026.
Join the Market Pulse Hub waitlist to get early access to full stock pages, scores and alerts for Pakistani investors.
Bilal, Market Pulse Hub
Figures are from company results, exchange data and our calculations up to 30 October 2026 and will change as new data arrives. This article is for education only and is not investment advice.