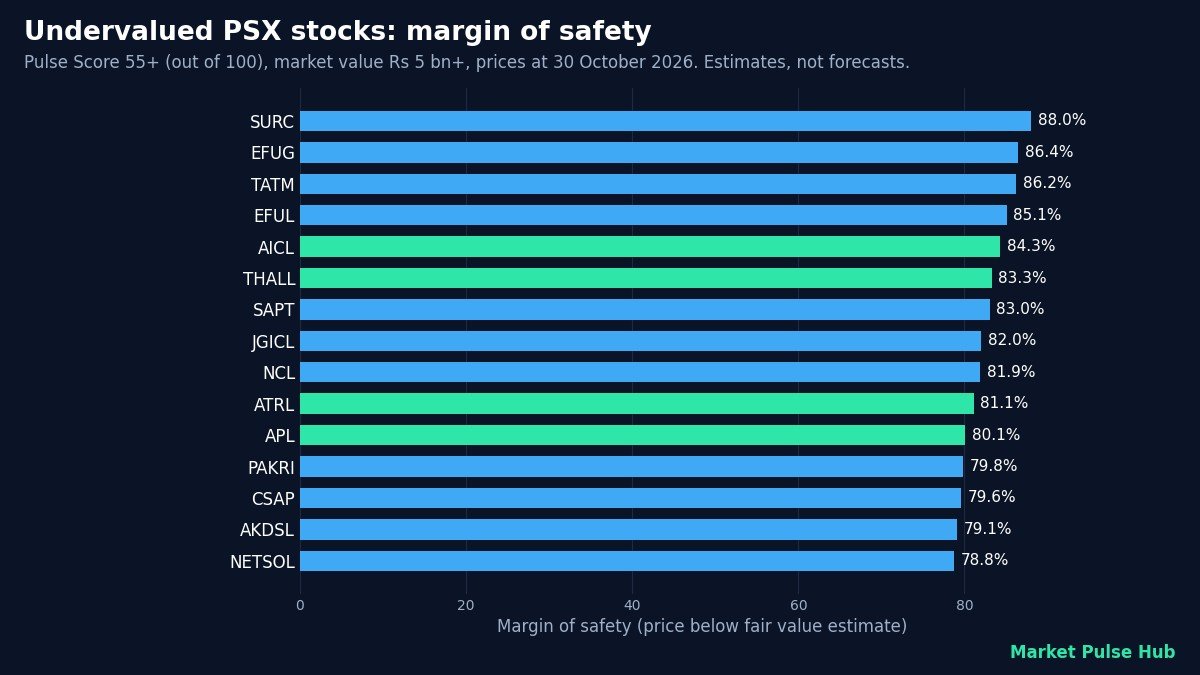
Searching for undervalued stocks Pakistan investors can research? This list ranks the Pakistan Stock Exchange (PSX) companies trading furthest below our fair value estimates, using closing prices on 30 October 2026. To keep it useful, we only include companies with a Pulse Score of at least 55, a market value of at least Rs 5 bn and no known problem in our data. A low price against a model is a reason to start reading, not a reason to buy, so each section also explains the limits of the numbers.
What fair value and margin of safety mean
The fair value on Market Pulse Hub is our estimate of what one share is worth. For most companies it is the average of up to four methods: a discounted cash flow model on free cash flow, a discounted cash flow model on earnings per share, a projected free cash flow method and a growth-adjusted P/E (often called the Peter Lynch method). Methods that give a negative or missing value are left out of the average. For banks we use a justified price to book method instead. When a company’s last 12 months earned more than twice its five-year norm, we value it from normalised earnings so that one windfall year is not projected for decades.
The margin of safety is how far the price sits below that estimate: (fair value minus price) divided by fair value. A margin of +50% means the share trades at half our estimate. A negative margin means the price is above it. Our intrinsic value and margin of safety explainer covers the idea step by step.
The Pulse Score is our measure of financial quality, scored out of 100. It combines five pillars, each scored out of 20: growth, stability (margins, debt, liquidity, cash backing of profits and return on equity), valuation, efficiency and cash flow, with stability weighted most. As a rough guide, 70 or more is good, 50 to 70 is average and under 50 is weak. We use it here as a quality filter, so the list is not filled with companies that look cheap only because their business is in trouble.
How we built this list of undervalued stocks in Pakistan
We started with the 250 PSX companies that have both a Pulse Score and a fair value estimate. 118 of them have a Pulse Score of 55 or more and a market value of Rs 5 bn or more. We then removed 15 companies whose latest quarterly profit in our data feed did not match the figure in the company’s own filing, because their scores and fair values may rest on a wrong number until the data is corrected. That leaves 103 companies, and the table shows the 20 with the highest margin of safety.
Across all 103 qualifying companies the median margin of safety is +57.1%, 60 show a margin above 50% and 11 are priced above their fair value estimate. That spread is itself a warning: when most of a market looks cheap on a model, the model’s assumptions deserve as much attention as the prices.
The 20 PSX stocks furthest below fair value
Closing prices on 30 October 2026. Red flags count the warning signs our checks found in each company’s accounts; zero is best. Market value is the share price times the number of shares.
| # | Stock | Company | Sector | Close (Rs) | Fair value (Rs) | Margin of safety | Pulse Score (out of 100) | Red flags | Market value (Rs bn) | KSE-100 |
|---|---|---|---|---|---|---|---|---|---|---|
| 1 | SURC | Suraj Cotton Mills | Textile Composite | 124.97 | 1,041.41 | +88.0% | 82.0 | 1 | 6.1 | No |
| 2 | EFUG | EFU General Insurance | Insurance | 123.00 | 907.30 | +86.4% | 64.4 | 0 | 24.6 | No |
| 3 | TATM | Tata Textile Mills | Textile Spinning | 142.13 | 1,032.08 | +86.2% | 55.6 | 1 | 8.0 | No |
| 4 | EFUL | EFU Life Assurance | Insurance | 114.00 | 764.25 | +85.1% | 66.0 | 1 | 12.0 | No |
| 5 | AICL | Adamjee Insurance Co | Insurance | 94.74 | 602.17 | +84.3% | 81.8 | 0 | 33.2 | Yes |
| 6 | THALL | Thal | Auto Parts | 500.00 | 2,988.28 | +83.3% | 73.2 | 0 | 40.5 | Yes |
| 7 | SAPT | Sapphire Textile Mills | Textile Composite | 1,580.63 | 9,317.50 | +83.0% | 60.3 | 1 | 34.3 | No |
| 8 | JGICL | Jubilee General Insurance Co | Insurance | 75.25 | 417.84 | +82.0% | 68.0 | 0 | 14.9 | No |
| 9 | NCL | Nishat Chunian | Textile Composite | 42.61 | 235.54 | +81.9% | 56.5 | 2 | 10.2 | No |
| 10 | ATRL | Attock Refinery | Refinery | 1,088.78 | 5,764.23 | +81.1% | 87.4 | 1 | 116.1 | Yes |
| 11 | APL | Attock Petroleum | Oil & Gas Marketing | 549.94 | 2,766.41 | +80.1% | 74.3 | 0 | 68.4 | Yes |
| 12 | PAKRI | Pakistan Reinsurance Co | Insurance | 16.07 | 79.66 | +79.8% | 78.5 | 1 | 14.5 | No |
| 13 | CSAP | Crescent Steel & Allied Products | Engineering | 81.96 | 401.47 | +79.6% | 80.1 | 2 | 6.4 | No |
| 14 | AKDSL | AKD Securities | Investment & Securities Cos. | 29.04 | 138.73 | +79.1% | 75.8 | 3 | 16.2 | No |
| 15 | NETSOL | Netsol Technologies | Technology | 119.15 | 561.07 | +78.8% | 65.0 | 3 | 10.7 | No |
| 16 | SAZEW | Sazgar Engineering Works | Automobile Assembler | 1,400.25 | 6,584.18 | +78.7% | 75.6 | 1 | 84.6 | Yes |
| 17 | GCIL | Ghani Chemical Industries | Chemical | 32.12 | 140.89 | +77.2% | 64.8 | 1 | 18.3 | No |
| 18 | ZAHID | ZAHIDJEE Textile Mills | Textile Composite | 57.03 | 248.12 | +77.0% | 69.9 | 1 | 10.9 | No |
| 19 | NATF | National Foods | Food & Personal Care | 309.05 | 1,292.53 | +76.1% | 61.1 | 3 | 72.0 | Yes |
| 20 | PRL | Pakistan Refinery | Refinery | 96.96 | 403.68 | +76.0% | 88.2 | 0 | 61.1 | No |
6 of the 20 are KSE-100 members, and the rest are smaller or less traded companies. The most common sectors are Insurance (5), Textile Composite (4), Refinery (2). 6 of the 20 have no red flags, and 10 were valued from normalised earnings because their recent profits were unusually high.
A closer look at four names
Suraj Cotton Mills (SURC)
Close Rs 124.97, fair value estimate Rs 1,041.41, margin of safety +88.0%, Pulse Score 82.0. The methods give DCF FCF Rs 1,886.88, DCF EPS Rs 1,082.21, Projected FCF Rs 436.25, Peter Lynch Rs 760.29. Strengths flagged by the model: Strong Piotroski F-score 8 / 9; Operating cash flow at or above net profit. Red flags: Sales growth not converting into profit growth (5-year CAGR). Its latest earnings were more than twice its five-year norm, so the model values it from normalised earnings. The four methods still range widely, which is a reason to treat the average with caution.
Adamjee Insurance Co (AICL)
Close Rs 94.74, fair value estimate Rs 602.17, margin of safety +84.3%, Pulse Score 81.8. The methods give DCF FCF Rs 937.98, DCF EPS Rs 465.60, Projected FCF Rs 678.02, Peter Lynch Rs 327.10. Strengths flagged by the model: Sales growing faster than sector (23% vs 22% a year); Operating cash flow at or above net profit. Red flags: none. It has no red flags, and its growth, valuation and cash flow pillars all score 20 out of 20. Insurers carry no inventory, so the efficiency pillar adds little here.
Attock Refinery (ATRL)
Close Rs 1,088.78, fair value estimate Rs 5,764.23, margin of safety +81.1%, Pulse Score 87.4. The methods give DCF FCF Rs 7,328.81, DCF EPS Rs 7,053.49, Projected FCF Rs 3,719.28, Peter Lynch Rs 4,955.33. Strengths flagged by the model: Strong Piotroski F-score 7 / 9; Sales growing faster than sector (22% vs 21% a year); Sales growth converting into profit growth; Operating cash flow at or above net profit. Red flags: Profit up 694% vs operating profit +504%: check other income, tax or one-offs. Its fair value was worked out from normalised earnings, because the last 12 months earned more than twice its five-year norm. Even so, the model still finds a wide gap. The red flag matters: when profit grows much faster than operating profit, part of the jump may come from other income, tax or one-off items.
AKD Securities (AKDSL)
Close Rs 29.04, fair value estimate Rs 138.73, margin of safety +79.1%, Pulse Score 75.8. The methods give DCF FCF Rs 27.55, DCF EPS Rs 294.53, Projected FCF Rs 25.95, Peter Lynch Rs 206.92. Strengths flagged by the model: Sales growing faster than sector (48% vs 22% a year); Sales growth converting into profit growth. Red flags: Cash not following profits: operating cash flow under half of net profit last year; High accruals (Sloan ratio 11%): earnings are not well backed by cash; Slow collections: 148 receivable days vs sector 190. This one shows why you should read the red flags before the margin of safety. Operating cash flow was under half of net profit last year, so reported earnings are not yet well backed by cash, and its fair value was worked out from normalised earnings. The four methods also disagree very widely: both cash flow methods put the value below the closing price of Rs 29.04, so the large margin comes entirely from the two earnings-based methods.
Why a big margin of safety is not a bargain on its own
Discounted cash flow models project past growth many years into the future. Pakistani companies have reported fast growth in rupee terms over the last five years, and part of that growth reflects inflation rather than real expansion. If growth slows, the estimates fall, sometimes sharply. This is the main reason so many margins in the table are above 50%.
Three checks help separate a real opportunity from a model quirk:
- Compare the methods. For SURC the four methods run from Rs 436.25 to Rs 1,886.88. When the methods disagree this much, give the average less weight.
- Read the red flags. A jump in profit that operating profit does not match, or profits that are not backed by cash, often means a one-off gain that will not repeat.
- Look at trading volume. Smaller companies can trade in low volumes, and a low price on a stock that rarely trades can be hard to buy or sell at that price.
It also helps to check the basics behind the valuation. Our P/E ratio explainer and P/B ratio explainer show how to compare price with earnings and book value, two quick sense checks on any model.
How to use this list
- Treat it as a research shortlist. Open each company’s latest results and annual report before forming a view.
- Prefer quality as well as price. Our ranking of the highest Pulse Scores starts from quality instead of price, and the two lists overlap only in part.
- Spread your risk. Several names come from the same sector, and sectors often move together.
- Recheck after results. Fair values change with every set of results and every price move. The live figures for each company are on the Market Pulse Hub dashboard.
Frequently asked questions
Which PSX stocks are the most undervalued right now?
On 30 October 2026, among companies with a Pulse Score of 55 or more and a market value of at least Rs 5 bn, Suraj Cotton Mills (SURC) had the highest margin of safety at +88.0%, followed by EFUG and TATM. These are model estimates that change with prices and results, not price targets.
What is a good margin of safety?
Many value investors look for a margin of 25% to 50% to allow for errors in their estimate. A larger margin gives more room for error, but only if the fair value itself is reasonable, so always check how it was worked out.
Why are so many PSX fair values far above the price?
The models project past growth, and recent rupee growth in Pakistan has been high, partly because of inflation. If future growth is slower, the estimates are too high. The median margin of safety across the 103 qualifying companies is +57.1%, which tells you as much about the models as about the market.
Does undervalued mean the share price will rise?
No. A share can stay cheap for years, or the business can get worse and the estimate can fall to meet the price. A margin of safety reduces risk only when the estimate is sound.
How often is this list updated?
Fair values and scores are recalculated as new prices and results arrive, so the order can change every week. The figures here are as of 30 October 2026.
Join the Market Pulse Hub waitlist to get early access to full stock pages, scores and alerts for Pakistani investors.
Bilal, Market Pulse Hub
Figures are from company results, exchange data and our calculations up to 30 October 2026 and will change as new data arrives. This article is for education only and is not investment advice.