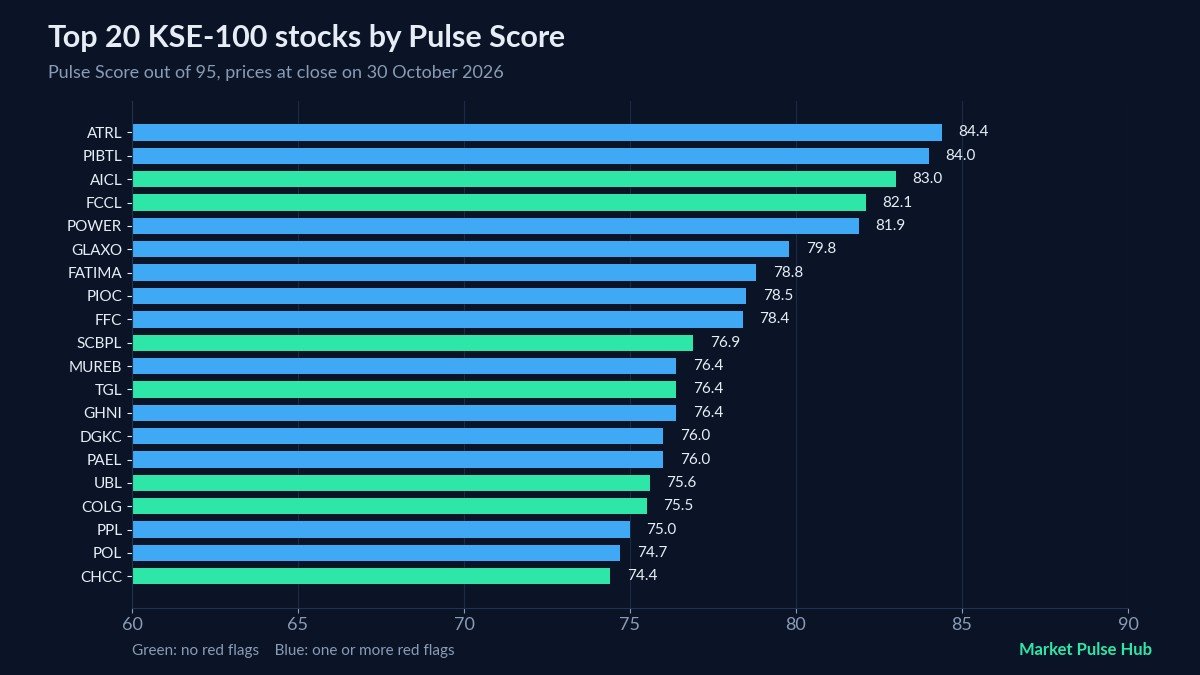
Looking for the best stocks PSX for long term investing? There is no stock that is right for everyone, but you can narrow the field by starting with companies that have strong, steady fundamentals. This page ranks the 20 KSE-100 companies with the highest Pulse Scores, our 95-point measure of financial quality, using prices at the close on 30 October 2026, and explains what drives each score so you can judge it for yourself.
How we picked the best stocks PSX for long term investors
We started with the KSE-100, the Pakistan Stock Exchange’s main index of 100 large and liquid companies. We score 99 of its members. We then left out 14 companies whose latest quarterly profit in our data feed did not match the figure in the company’s own filing, because their scores may rest on a wrong number until the data is corrected. From the rest we took the 20 highest Pulse Scores that also have a fair value estimate. The median score across the KSE-100 members we score is 61.1, so every company below sits well above the middle of the index.
The Pulse Score is our overall measure of a company’s financial quality. It combines five pillars, each scored out of 20: growth (five-year growth in sales, profit and earnings per share), stability (margins, debt, liquidity, cash backing of profit and return on equity), valuation (price against earnings, book value, sales and dividends), efficiency (inventory and collection speed against the sector) and cash flow. The pillars are weighted, with stability counting most, for a maximum of 95. Roughly, 70 or more is good, 50 to 70 is average and under 50 is weak.
The fair value is our estimate of what one share is worth, averaged from up to four valuation methods (two discounted cash flow models, projected free cash flow and a growth-adjusted P/E). For banks we use a justified price to book method instead. The margin of safety is how far the price sits below that estimate: +50% means the price is half the fair value, and a negative figure means the price is above it. Both are model estimates, not forecasts. Our intrinsic value and margin of safety explainer explains the idea in more detail.
The 20 highest Pulse Scores in the KSE-100
Prices are closing prices on 30 October 2026. Red flags count the warning signs found in each company’s accounts; zero is best.
| # | Stock | Sector | Close (Rs) | Pulse Score (of 95) | Fair value (Rs) | Margin of safety | Red flags |
|---|---|---|---|---|---|---|---|
| 1 | ATRL | Refinery | 1,088.78 | 84.4 | 5,764.23 | +81.1% | 1 |
| 2 | PIBTL | Transport | 12.93 | 84.0 | 44.15 | +70.7% | 1 |
| 3 | AICL | Insurance | 94.74 | 83.0 | 602.17 | +84.3% | 0 |
| 4 | FCCL | Cement | 52.28 | 82.1 | 122.58 | +57.3% | 0 |
| 5 | POWER | Cement | 21.39 | 81.9 | 62.61 | +65.8% | 1 |
| 6 | GLAXO | Pharmaceuticals | 319.39 | 79.8 | 574.28 | +44.4% | 1 |
| 7 | FATIMA | Fertilizer | 134.56 | 78.8 | 394.20 | +65.9% | 2 |
| 8 | PIOC | Cement | 233.14 | 78.5 | 753.99 | +69.1% | 1 |
| 9 | FFC | Fertilizer | 559.49 | 78.4 | 1,267.21 | +55.8% | 1 |
| 10 | SCBPL | Commercial Banks | 59.57 | 76.9 | 49.76 | -19.7% | 0 |
| 11 | MUREB | Food & Personal Care Products | 898.95 | 76.4 | 2,632.36 | +65.9% | 2 |
| 12 | TGL | Glass & Ceramics | 170.44 | 76.4 | 552.43 | +69.1% | 0 |
| 13 | GHNI | Automobile Assembler | 1,151.44 | 76.4 | 3,273.03 | +64.8% | 1 |
| 14 | DGKC | Cement | 178.15 | 76.0 | 652.17 | +72.7% | 1 |
| 15 | PAEL | Cable & Electrical Goods | 32.33 | 76.0 | 81.29 | +60.2% | 3 |
| 16 | UBL | Commercial Banks | 409.68 | 75.6 | 438.43 | +6.6% | 0 |
| 17 | COLG | Food & Personal Care Products | 1,179.42 | 75.5 | 1,499.85 | +21.4% | 0 |
| 18 | PPL | Oil & Gas Exploration Companies | 213.93 | 75.0 | 649.97 | +67.1% | 1 |
| 19 | POL | Oil & Gas Exploration Companies | 667.04 | 74.7 | 2,326.80 | +71.3% | 1 |
| 20 | CHCC | Cement | 267.53 | 74.4 | 678.42 | +60.6% | 0 |
A few patterns stand out. Cement is the most common sector with 5 companies, and no other sector has more than 2. 7 of the 20 have no red flags at all, and 7 are members of the KMI-30 Shariah index (see our KMI-30 stocks list if that matters to you). Only one company is priced above the fair value estimate, so a high score does not always come with a low price.
What drives the top scores
Below are the five companies that best show how the score works. The pillar scores are out of 20 each before weighting.
Attock Refinery (ATRL)
Pulse Score 84.4, pillar scores growth 15.0, stability 18.0, valuation 17.1, efficiency 15.0 and cash flow 20.0 (each out of 20). Fair value estimate Rs 5,764.23 against a close of Rs 1,088.78. Strengths flagged by the model: strong Piotroski F-score 7 / 9; sales growing faster than sector (22% vs 21% a year); sales growth converting into profit growth. Watch-outs: profit up 694% vs operating profit +504%: check other income, tax or one-offs. The model rewards it across almost every pillar, but the watch-out matters: when profit grows much faster than operating profit, part of the jump can come from other income, tax or one-off items, so the latest result may not repeat.
Pakistan International Bulk Terminal (PIBTL)
Pulse Score 84.0, pillar scores growth 10.0, stability 17.0, valuation 20.0, efficiency 20.0 and cash flow 20.0 (each out of 20). Fair value estimate Rs 44.15 against a close of Rs 12.93. Strengths flagged by the model: strong Piotroski F-score 9 / 9; sales growth converting into profit growth; operating cash flow at or above net profit. Watch-outs: profit up 458% vs operating profit +97%: check other income, tax or one-offs. A perfect Piotroski score and full marks on valuation, efficiency and cash flow lift it near the top, while growth is its weakest pillar. The same profit-versus-operating-profit check applies here.
Adamjee Insurance Co. (AICL)
Pulse Score 83.0, pillar scores growth 20.0, stability 16.0, valuation 20.0, efficiency 4.0 and cash flow 20.0 (each out of 20). Fair value estimate Rs 602.17 against a close of Rs 94.74. Strengths flagged by the model: sales growing faster than sector (23% vs 22% a year); operating cash flow at or above net profit. No red flags were triggered. Insurers have no inventory, so the efficiency pillar says little here; the score is carried by growth, valuation and cash flow.
Fauji Cement Co. (FCCL)
Pulse Score 82.1, pillar scores growth 20.0, stability 17.0, valuation 17.5, efficiency 2.5 and cash flow 20.0 (each out of 20). Fair value estimate Rs 122.58 against a close of Rs 52.28. Strengths flagged by the model: sales growing faster than sector (31% vs 12% a year); sales growth converting into profit growth; operating cash flow at or above net profit. No red flags were triggered. It scores full marks for growth and cash flow with no red flags, which is the kind of balance long-term investors usually look for. Its efficiency score is low against the sector.
Standard Chartered Bank (Pakistan) (SCBPL)
Pulse Score 76.9, pillar scores growth 16.7, stability 16.4, valuation 12.9, efficiency 12.0 and cash flow 20.0 (each out of 20). Fair value estimate Rs 49.76 against a close of Rs 59.57. Strengths flagged by the model: sales growth converting into profit growth; operating cash flow at or above net profit. No red flags were triggered. It is the only name in the list priced above its fair value estimate, a reminder that a high quality score and a cheap price are two different things. For banks the fair value comes from a justified price to book method rather than cash flow models.
Why fair values should be read with care
16 of the 20 companies in the table show a margin of safety above 50%. That is a sign of how the models work, not proof that the market has missed something. Discounted cash flow models project past growth into the future. Pakistani companies have reported fast growth in rupee terms over the last five years, and part of that growth can reflect inflation rather than real expansion. If that growth slows, the estimates fall.
The spread between methods is a useful check. For Attock Refinery the four methods give DCF FCF Rs 7,328.81, DCF EPS Rs 7,053.49, Projected FCF Rs 3,719.28, Peter Lynch Rs 4,955.33. When methods disagree this widely, give the average less weight and look at the company’s own reports, its debt, its dividend record and the outlook for its sector. Our P/E ratio explainer and ROE explainer explain two of the ratios behind the score.
How to use this list
- Treat it as a shortlist, not a buy list. A high Pulse Score tells you where to start reading.
- Check the red flags first. Warnings such as high accruals (profit not backed by cash) or slow customer payments deserve a look at the annual report.
- Look at the weakest pillar. A strong total with one very low pillar can hide a real problem.
- Spread your risk. Several names in the list come from the same sector, and sectors can fall together.
- Follow the changes. Scores move after each results season; the live rankings and each company’s full breakdown are on the Market Pulse Hub dashboard, and our guide to reading a stock page shows how to read them.
Frequently asked questions
What are the best stocks on PSX for long term investment?
There is no single answer, because it depends on your goals, time frame and how much risk you can take. As a starting point, this page lists the 20 KSE-100 companies with the highest Pulse Scores on 30 October 2026, led by Attock Refinery at 84.4 out of 95. A high score means strong fundamentals on paper, not a guaranteed return.
What is a good Pulse Score?
The Pulse Score runs up to 95. As a rough guide, 70 or more is good, 50 to 70 is average and under 50 is weak. Every company in this list scores above 70. Check the pillar scores too: one very weak pillar can matter more than a high total.
Why do so many fair values look far above the price?
The fair value is an average of up to four models, and those models are sensitive to past growth rates. After several years of high inflation and fast rupee growth in sales and profits, they can produce values well above today’s prices. Treat a large margin of safety as a prompt to research, not as a price target. For Attock Refinery the four methods range from Rs 3,719.28 to Rs 7,328.81, which shows how uncertain such estimates are.
How often does this list change?
Scores and fair values are recalculated as new prices and company results arrive, so the order can change after every results season. The live rankings are on the dashboard.
Should I buy the stock with the highest score?
This list is for education and research, not a recommendation to buy or sell. Read each company’s reports, check its red flags, spread your money across several companies and sectors, and speak to a licensed adviser if you are unsure.
Join the Market Pulse Hub waitlist to get early access to full stock pages, scores and alerts for Pakistani investors.
Bilal, Market Pulse Hub
Figures are from company results, exchange data and our calculations up to 30 October 2026 and will change as new data arrives. This article is for education only and is not investment advice.