Which are the most profitable companies in Pakistan? There is more than one way to answer, so this page ranks large Pakistan Stock Exchange (PSX) companies on two measures: return on equity (ROE), which shows how much profit a company earns on its shareholders’ money, and net margin, which shows how much of each rupee of sales ends up as profit. Figures cover the last 12 months of reported results, with prices and data as of 30 October 2026.
ROE and net margin in plain words
Return on equity is net profit divided by shareholders’ equity. An ROE of 25% means the company earned Rs 25 of profit for every Rs 100 of equity on its balance sheet. It is the most direct answer to “how well does this business use its owners’ money?” Our ROE explainer covers the formula and its traps.
Net margin is net profit divided by revenue. A net margin of 20% means Rs 20 of every Rs 100 of sales is left as profit after all costs, interest and tax. Margins depend heavily on the type of business: a refinery or a car assembler can be very profitable on a thin margin because it sells huge volumes. Our net margin explainer shows how to compare margins fairly.
We also show each company’s Pulse Score, our measure of overall financial quality, scored out of 100, across growth, stability, valuation, efficiency and cash flow. Roughly, 70 or more is good, 50 to 70 is average and under 50 is weak. High profitability is one part of that score, not all of it.
How we ranked the most profitable companies in Pakistan
We started with the 162 PSX companies with a market value of at least Rs 10 bn that we score. We removed 24 whose latest quarterly profit in our data feed did not match the company’s own filing, leaving 138. ROE is ranked across all of them, including 20 banks. Net margin is ranked without banks, because a bank’s revenue is mostly interest income and its margin cannot be compared with a manufacturer’s.
Across the 132 companies with an ROE figure, the median ROE is 15.9%. Across the 112 non-bank companies with a margin figure, the median net margin is 8.0%. Every company in the tables below sits well above those middles.
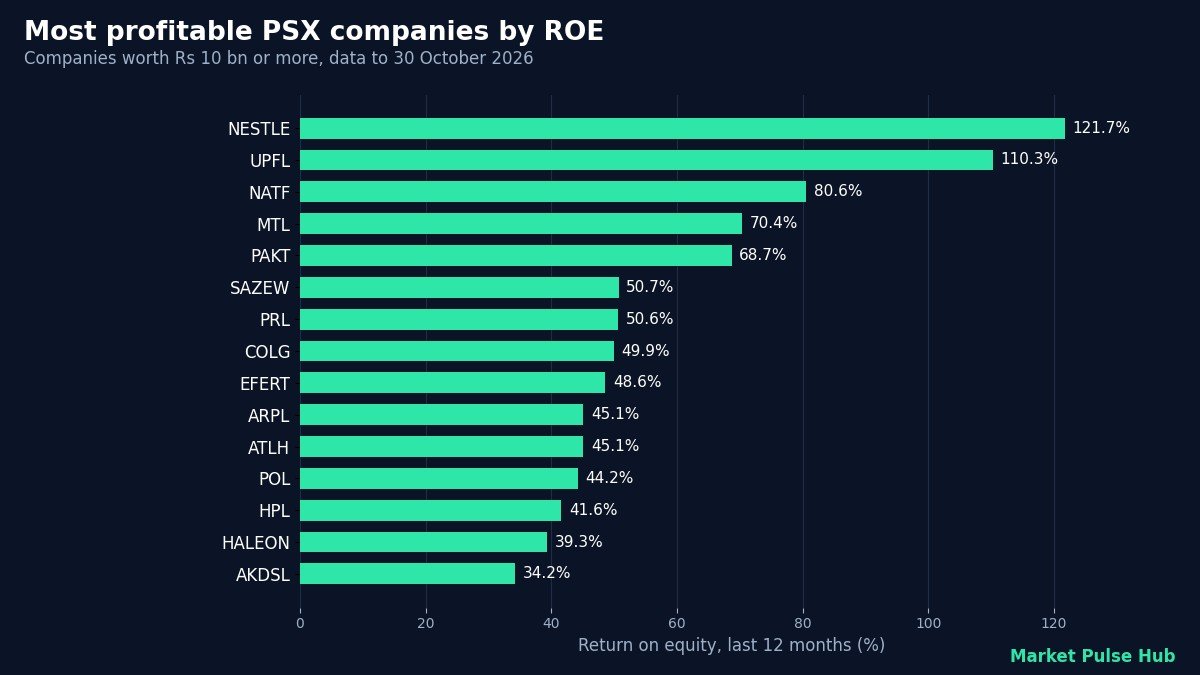
Top 20 PSX companies by return on equity
ROE and net margin are for the last 12 months. Debt to equity compares borrowings with shareholders’ equity; “n/a” means we have no figure.
| # | Stock | Company | Sector | ROE | Net margin | Debt / equity | Market value (Rs bn) | Pulse Score (out of 100) |
|---|---|---|---|---|---|---|---|---|
| 1 | NESTLE | Nestle Pakistan | Food & Personal Care | 121.7% | 8.5% | 0.13x | 319.5 | 65.5 |
| 2 | UPFL | Unilever Pakistan Foods | Food & Personal Care | 110.3% | 16.0% | 0.07x | 167.4 | 60.4 |
| 3 | NATF | National Foods | Food & Personal Care | 80.6% | 49.6% | 0.33x | 72.0 | 61.1 |
| 4 | MTL | Millat Tractors | Automobile Assembler | 70.4% | 12.3% | 1.30x | 111.8 | 67.2 |
| 5 | PAKT | Pakistan Tobacco Co | Tobacco | 68.7% | 22.3% | 0.09x | 378.9 | 67.5 |
| 6 | SAZEW | Sazgar Engineering Works | Automobile Assembler | 50.7% | 11.6% | 0.16x | 84.6 | 75.6 |
| 7 | PRL | Pakistan Refinery | Refinery | 50.6% | 6.9% | 0.21x | 61.1 | 88.2 |
| 8 | COLG | Colgate-Palmolive | Food & Personal Care | 49.9% | 14.2% | 0.02x | 286.3 | 77.3 |
| 9 | EFERT | Engro Fertilizers | Fertilizer | 48.6% | 9.8% | 1.64x | 260.4 | 55.5 |
| 10 | ARPL | Archroma Pakistan | Chemical | 45.1% | 6.5% | 0.94x | 12.4 | 62.0 |
| 11 | ATLH | Atlas Honda | Automobile Assembler | 45.1% | 7.4% | 0.01x | 205.1 | 77.2 |
| 12 | POL | Pakistan Oilfields | Oil & Gas Exploration | 44.2% | 53.9% | n/a | 189.3 | 73.0 |
| 13 | HPL | Hoechst Pakistan | Pharmaceuticals | 41.6% | 11.3% | 0.06x | 38.6 | 80.6 |
| 14 | HALEON | Haleon Pakistan | Pharmaceuticals | 39.3% | 16.1% | 0.01x | 77.1 | 69.0 |
| 15 | AKDSL | AKD Securities | Investment & Securities Cos. | 34.2% | 120.4% | 0.01x | 16.2 | 75.8 |
| 16 | FCEPL | Frieslandcampina Engro Pakistan | Food & Personal Care | 34.0% | 6.3% | 0.17x | 104.5 | 64.8 |
| 17 | GHNI | Ghandhara Industries | Automobile Assembler | 31.8% | 11.7% | n/a | 49.1 | 79.4 |
| 18 | FFC | Fauji Fertilizer Co | Fertilizer | 31.8% | 17.2% | 0.36x | 805.1 | 80.5 |
| 19 | GLAXO | GlaxoSmithKline Pakistan | Pharmaceuticals | 31.5% | 15.8% | 0.01x | 101.7 | 79.6 |
| 20 | MEBL | Meezan Bank | Commercial Banks | 31.2% | 18.9% | 2.92x | 955.2 | 54.9 |
Nestle Pakistan (NESTLE) leads with an ROE of 121.7%. 2 companies have an ROE above 100%, which means the last 12 months’ profit was larger than the equity on the balance sheet. That can happen when a company pays out most of its profit as dividends and keeps a small equity base, which makes the ratio look very high. A very high ROE is still a strong sign, but compare it with the company’s own history before reading too much into it.
Debt matters too. ROE can be lifted by borrowing, because debt lets a company earn on money that is not its shareholders’. In the table, 3 companies have debt to equity above 1x, so part of their return comes from leverage.
Top 15 non-bank PSX companies by net margin
| # | Stock | Company | Sector | Net margin | Operating margin | ROE | Market value (Rs bn) |
|---|---|---|---|---|---|---|---|
| 1 | AKDSL | AKD Securities | Investment & Securities Cos. | 120.4% | 151.6% | 34.2% | 16.2 |
| 2 | PSX | Pakistan Stock Exchange | Investment & Securities Cos. | 72.9% | 16.1% | 15.4% | 32.5 |
| 3 | OGDC | Oil & Gas Development Co | Oil & Gas Exploration | 54.1% | 44.7% | 16.6% | 1,319.4 |
| 4 | POL | Pakistan Oilfields | Oil & Gas Exploration | 53.9% | 52.6% | 44.2% | 189.3 |
| 5 | NATF | National Foods | Food & Personal Care | 49.6% | 10.9% | 80.6% | 72.0 |
| 6 | MARI | Mari Energies | Oil & Gas Exploration | 45.7% | 44.4% | 28.1% | 758.2 |
| 7 | JVDC | Javedan Corporation | Property | 43.2% | 42.4% | 12.5% | 48.7 |
| 8 | PPL | Pakistan Petroleum | Oil & Gas Exploration | 36.3% | 46.5% | 12.8% | 582.1 |
| 9 | GCIL | Ghani Chemical Industries | Chemical | 35.0% | 43.4% | 25.2% | 18.3 |
| 10 | ATIL | Atlas Insurance | Insurance | 34.8% | 55.5% | 21.8% | 11.4 |
| 11 | PAKRI | Pakistan Reinsurance Co | Insurance | 28.0% | 41.8% | 13.7% | 14.5 |
| 12 | KOHC | Kohat Cement Co | Cement | 27.6% | 34.1% | 17.9% | 79.2 |
| 13 | PABC | Pakistan Aluminium Beverage Cans | Miscellaneous | 26.4% | 24.9% | 14.2% | 34.2 |
| 14 | THALL | Thal | Auto Parts | 24.6% | 9.7% | 15.8% | 40.5 |
| 15 | JGICL | Jubilee General Insurance Co | Insurance | 24.6% | 39.3% | 19.5% | 14.9 |
Oil and gas exploration companies take 4 of the 15 places. A few figures need care:
- AKDSL shows a net margin of 120.4%, more than its revenue. This happens when large gains, for example on investments, are booked outside revenue. It is not a margin the core business earns.
- PSX has a net margin of 72.9% against an operating margin of 16.1%. When net margin is much higher than operating margin, it suggests a large part of profit comes from outside normal operations, such as other income, tax effects or one-off items. Red flags raised by our checks: none.
- NATF has a net margin of 49.6% against an operating margin of 10.9%. When net margin is much higher than operating margin, it suggests a large part of profit comes from outside normal operations, such as other income, tax effects or one-off items. Red flags raised by our checks: Cash not following profits: operating cash flow under half of net profit last year; High accruals (Sloan ratio 37%): earnings are not well backed by cash; Profit up 469% vs operating profit +11%: check other income, tax or one-offs.
- THALL has a net margin of 24.6% against an operating margin of 9.7%. When net margin is much higher than operating margin, it suggests a large part of profit comes from outside normal operations, such as other income, tax effects or one-off items. Red flags raised by our checks: none.
3 companies appear in both tables: NATF, POL, AKDSL. High returns on equity together with wide margins can point to pricing power or a cost advantage. Here, though, NATF and AKDSL carry the margin caveats above, which leaves POL as the cleaner example of both measures at once.
What about banks?
Banks are judged mainly on ROE. The highest bank ROE figures in our data are MEBL (31.2%), UBL (27.7%), SCBPL (22.8%). Banks run with far more debt than other companies, mostly customer deposits, so a high bank ROE should be read alongside capital strength and asset quality. Our comparison of PSX bank stocks looks at price to book, ROE, dividend yield and fair value for every listed bank.
How to use these rankings
- Profitable is not the same as cheap. The best businesses often trade at higher prices. Check the P/E and our fair value estimate, which is our model’s view of what one share is worth, before forming a view. Our P/E ratio explainer is a good start.
- Look at the trend. One strong year can come from a windfall. Several years of steady ROE are more meaningful.
- Check that profits turn into cash. Our checks flag companies whose operating cash flow lags their profits.
- Compare like with like. Rank margins within a sector, not across the whole market. You can filter companies by sector, ROE and margin on the Market Pulse Hub dashboard.
Frequently asked questions
What is the most profitable company in Pakistan?
It depends on the measure. Among PSX companies worth Rs 10 bn or more, Nestle Pakistan (NESTLE) had the highest return on equity at 121.7% on 30 October 2026. By net margin, excluding banks, AKD Securities (AKDSL) ranked first at 120.4%, though that figure includes gains booked outside revenue. By total net profit over the last 12 months, the largest in our data were OGDC (Rs 262.6 bn), UBL (Rs 146.5 bn), PPL (Rs 102.9 bn).
What is a good ROE for a PSX company?
An ROE above 15% is generally considered strong, and above 20% very strong, as long as it is not driven mainly by debt or a one-off gain. The median across the companies we ranked is 15.9%.
Why are banks left out of the net margin ranking?
A bank’s revenue is mostly interest income and its costs include interest paid to depositors, so its margin is built differently from a manufacturer’s. Comparing them would not be fair, so banks are ranked on ROE only.
Can a company have an ROE above 100%?
Yes. It happens when profit for the year is larger than shareholders’ equity, for example when a company pays out most of its earnings and keeps little equity. 2 companies in our top 20 are in that position.
Are the most profitable companies the best investments?
Not necessarily. Strong profitability is a good sign, but the share price may already reflect it, and profits can fall. This list is for research and education, not a recommendation to buy or sell.
Join the Market Pulse Hub waitlist to get early access to full stock pages, scores and alerts for Pakistani investors.
Bilal, Market Pulse Hub
Figures are from company results, exchange data and our calculations up to 30 October 2026 and will change as new data arrives. This article is for education only and is not investment advice.