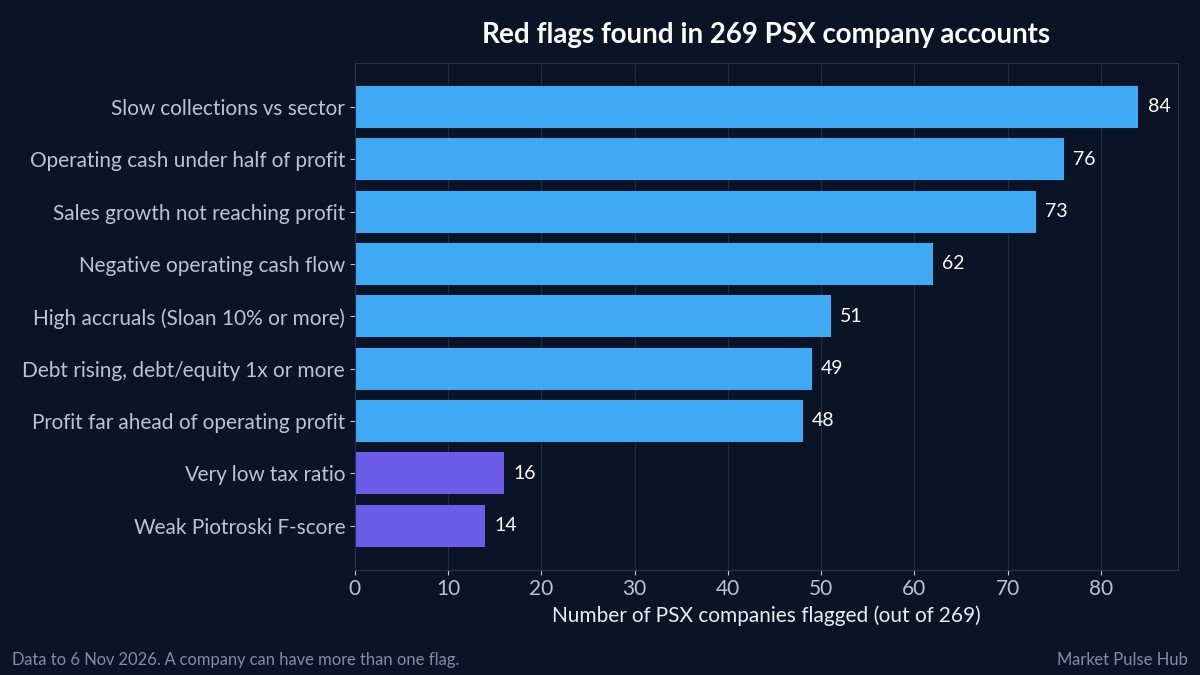
Financial red flags are warning signs in a company’s accounts that profits may be weaker, riskier or less real than they look. They often appear in the cash flow statement, the balance sheet or the notes long before a share price reacts. In this guide we explain the nine red flag checks we run on every company we cover on the Pakistan Stock Exchange (PSX), show how often each one appeared across 269 companies using data up to 6 November 2026, and explain how to check them yourself.
Why financial red flags matter
Reported profit is an accounting number. It includes estimates, timing choices and one-off items. Cash is harder to dress up. Most red flags are about a gap between what the profit and loss account says and what the cash flow statement or balance sheet shows. A single flag is not proof of a problem; there is often an innocent reason, such as a big order delivered just before the year end. But several flags together are a good reason to read the annual report carefully before you put money in.
Every company page on Market Pulse Hub lists its red flags next to its Pulse Score. The Pulse Score is our estimate of a company’s financial quality and value, scored out of 100 from about 30 checks on growth, stability, valuation, working capital and cash flow taken from its published accounts. It is an estimate, not a recommendation. Our guide on how to read a stock page shows where to find them.
The 9 financial red flags we check
Here is each check, what it means, and how many of the 269 companies carried it on 6 November 2026. We do not name companies here: the aim is to teach the method, not to single anyone out.
| Red flag | What it can mean | Companies flagged (of 269) |
|---|---|---|
| Slow collections compared with the sector | Customers take a long time to pay, so cash is tied up | 84 |
| Operating cash flow under half of net profit last year | Profit is not turning into cash | 76 |
| Sales growth not converting into profit growth (5 years) | Costs or competition are eating margins | 73 |
| Negative cash flow from operations last year | The business used more cash than it brought in | 62 |
| High accruals (Sloan ratio of 10% or more) | Earnings rely on accounting entries rather than cash | 51 |
| Debt rising, with debt to equity of 1x or more | Borrowing is growing on an already geared balance sheet | 49 |
| Net profit growing much faster than operating profit | Profit may rest on other income, tax or one-off items | 48 |
| Very low tax ratio (10% or below) | Profit may rest on tax credits or exemptions | 16 |
| Weak Piotroski F-score (3 or below out of 9) | Most basic measures of financial health are getting worse | 14 |
1. Cash not following profits
If a company reports a profit of Rs 100 but its operating cash flow is only Rs 40, something is absorbing the cash: rising receivables, more inventory, or profit that exists only on paper. Over several years, good businesses usually turn most of their profit into cash. In our data, 76 companies had operating cash flow under half of net profit last year, and 62 had negative operating cash flow altogether. Our free cash flow explainer shows how to read this part of the accounts.
2. High accruals
The Sloan ratio measures how much of a company’s earnings come from accruals (accounting entries such as unpaid sales and capitalised costs) rather than cash, relative to its total assets. A high figure means earnings are not well backed by cash, and research has long linked high accruals with weaker future profits. In our data, 51 companies had a Sloan ratio of 10% or more; the highest was 77%. Our accruals ratio explainer walks through the calculation.
3. Slow collections
Receivable days measure how long customers take to pay. If a company’s receivable days are far above its sector, or keep rising, it may be selling on easy credit to hit sales targets, or struggling to collect from weak customers. This was the most common flag in our data, on 84 companies. In Pakistan it is common in sectors that sell to the government or to power distribution companies, which is why we compare each company with its own sector. See receivable and inventory days explained.
4. Sales growth that does not reach profit
When sales have grown faster than profit over five years, margins are being squeezed by costs, energy prices, finance costs or competition. Growth is only valuable if some of it reaches shareholders. 73 companies carried this flag.
5. Rising debt on a geared balance sheet
We flag a company when its debt is rising and its debt to equity ratio is already high. In every case flagged, debt to equity was 1x or more, and the highest was 11.4x. With Pakistan’s interest rates in double digits, heavy borrowing can wipe out profit through finance costs. 49 companies carried this flag.
6. Profit growing much faster than operating profit
If net profit jumps far more than operating profit, the extra came from below the operating line: other income, a gain on selling assets, a lower tax charge or another one-off. These can be real, but they rarely repeat. 48 companies carried this flag. Always read the notes to see where the extra profit came from.
7. Very low tax ratio
Pakistani companies normally pay a large share of profit in tax. A tax charge of 10% of profit or less can mean the company is using tax credits, exemptions or losses brought forward, which may run out. 16 companies carried this flag, with tax ratios from 0% to 10%.
8. Weak Piotroski F-score
The Piotroski F-score gives a company one point for each of nine signs of improving health, such as positive cash flow, falling debt and rising margins. A score of 3 or below means most of those signs are pointing the wrong way. 14 companies scored between 1 and 3 out of 9. Our Piotroski F-score explainer lists all nine tests.
Do companies with more red flags score lower?
We grouped the 269 companies by how many flags they carried and compared their median Pulse Score and their median share price change over the past year.
| Number of red flags | Companies | Median Pulse Score (out of 100) | Median share price change, 4 Nov 2025 to 6 Nov 2026 |
|---|---|---|---|
| None | 61 | 64.2 | -7.3% |
| 1 | 73 | 62.4 | -7.4% |
| 2 | 56 | 49.9 | -13.8% |
| 3 or more | 79 | 45.8 | -15.8% |
Companies with two or more flags had clearly lower Pulse Scores. Over the past year their share prices also fell further: the median company with three or more flags fell 15.8%, against 7.3% for companies with none. Price changes here exclude dividends, and one year is a short period, so this does not prove that red flags cause price falls. It does suggest the market often notices these problems sooner or later.
Note on banks: none of the 20 banks in our data carried more than one flag. Cash flow tests built for manufacturers and traders do not suit lenders, whose operating cash flow swings with deposits and loans. For banks, focus on capital, asset quality and return on equity instead.
How to check red flags yourself
- Put profit and operating cash flow side by side for at least three years. Both are in the annual report and in quarterly accounts. Our walkthrough on how to read financial statements shows where to find them.
- Compare receivables and inventory with sales. If they grow much faster than sales, ask why.
- Read the “other income” and taxation notes whenever profit jumps.
- Look at borrowing and finance costs against operating profit.
- Read the auditor’s report. Any qualified opinion or “emphasis of matter” paragraph deserves attention.
- Count the flags, do not just spot one. One flag with a clear explanation is common. Three or more is a pattern.
You can see the red flags, Pulse Score and fair value estimate for every company we cover on the Market Pulse Hub dashboard.
Frequently asked questions
What are financial red flags?
They are warning signs in a company’s accounts that its profits may be weaker or less reliable than they look. Common examples are profit that does not turn into cash, high accruals, slow collections, rising debt and profit boosted by one-off items.
Does a red flag mean I should avoid a stock?
Not on its own. Many flags have a reasonable explanation, and a single flag is common: 73 of the 269 companies we cover had exactly one. Use flags as a list of questions to answer by reading the annual report, not as a verdict.
Which red flag is the most serious?
Persistent gaps between profit and operating cash flow are usually the most important, because a business that never turns profit into cash cannot pay dividends or repay debt for long. Several flags together are more serious than any single one.
How often are the red flags updated?
Our checks run on the latest published annual and quarterly accounts, so flags can appear or disappear when a company reports new results.
Why do banks have fewer red flags?
Most of our cash flow and working capital checks are designed for manufacturing and trading companies. Banks work differently, so their operating cash flow is not a useful test of earnings quality.
Want alerts when a company you follow gains or loses a red flag? Join the Market Pulse Hub waitlist.
Figures are from company results, exchange data and our calculations up to 6 November 2026 and will change as new data arrives. This article is for education only and is not investment advice.