Defensive stocks Pakistan investors talk about are companies whose profits hold up when the economy slows, because people keep buying what they sell: food, fuel, electricity. Cyclical stocks are the opposite: their profits rise and fall with the economy, interest rates and construction activity. Knowing which is which helps you build a portfolio that does not fall apart in a bad year. In this guide we sort PSX sectors into cyclical and defensive, then check the labels against real data up to 6 November 2026: how much each sector moved with the KSE-100, and how the index behaved through past interest rate cycles.
Cyclical vs defensive: the basic idea
Cyclical companies sell things people and businesses can delay: cement and steel for construction, cars, textiles, chemicals, and loans. When growth is strong and borrowing is cheap, their sales and margins jump. When the economy slows or rates rise, profits can fall sharply. Their share prices tend to swing more than the market.
Defensive companies sell everyday needs or earn steady, regulated or dollar-linked income: food and household goods, power, tobacco, fertilizer, and in Pakistan oil and gas production, refining and banking. Their sales are steadier in a downturn, many pay regular dividends, and their share prices usually move less than the market. The trade-off is that they often rise less in a strong bull market.
Some labels are specific to Pakistan. We count oil and gas explorers and refineries as defensive because fuel demand is steady and their prices are dollar-linked or set by formula, so a weaker rupee often helps them. Banks count as defensive too: they earn more when interest rates are high, although a weak economy can raise bad loans. Fertilizer is an essential product, but its profits depend on gas pricing and government policy, so we call it quasi-cyclical. Pharmaceuticals we count as cyclical, because drug prices are regulated by DRAP while costs rise with the rupee and inflation.
How we measured it: beta and volatility
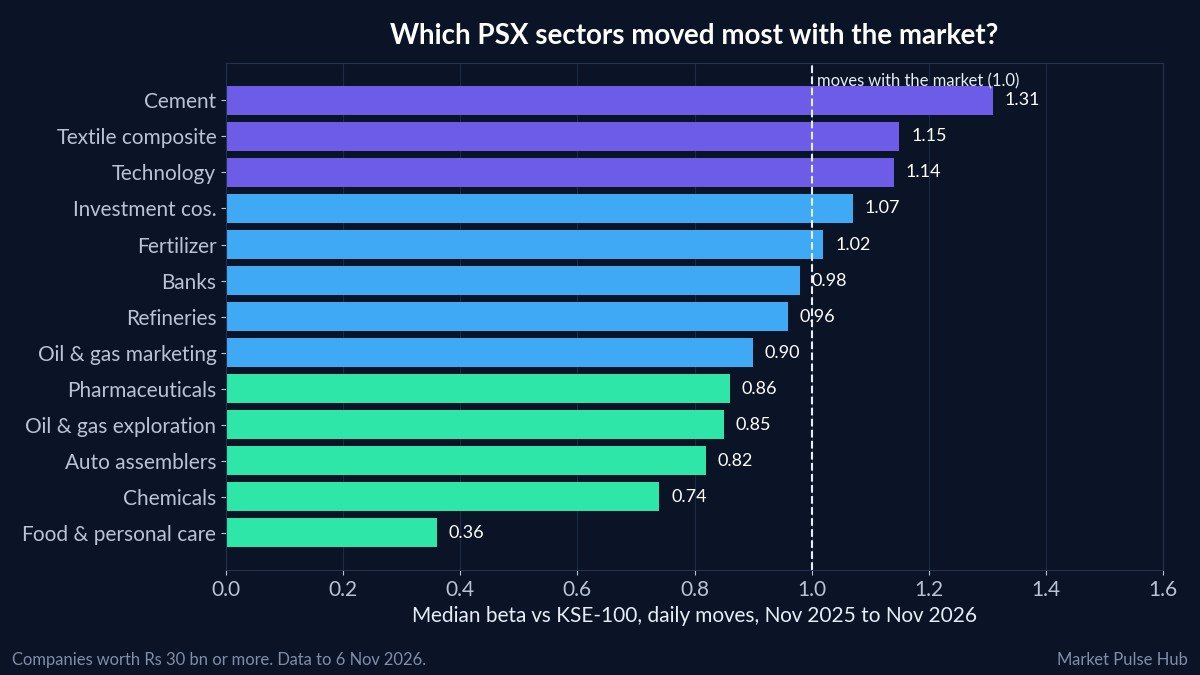
Beta measures how much a share moves when the market moves. A beta of 1 means it moved in line with the KSE-100 on average; 0.5 means about half as much; 1.3 means 30% more. We calculated beta from daily price moves between 4 November 2025 and 6 November 2026 for every company worth Rs 30 bn or more, then took the median for each sector with at least three such companies. Volatility is the annualised swing in daily prices. Share price changes exclude dividends, so we show dividend yield separately. Over the same period the KSE-100, which includes dividends, rose 7.8%.
Defensive stocks Pakistan data: PSX sectors compared
All figures are sector medians for companies worth Rs 30 bn or more, from 4 November 2025 to 6 November 2026, sorted from the lowest beta to the highest.
| Sector | Our label | Companies | Beta | Volatility | 1-year price change | Dividend yield | Largest names |
|---|---|---|---|---|---|---|---|
| Food and personal care | Defensive | 8 | 0.36 | 24.8% | -13.8% | 4.6% | NESTLE, COLG, UPFL |
| Chemicals | Cyclical | 4 | 0.74 | 35.6% | 8.2% | 5.8% | LCI, LOTCHEM, PAKOXY |
| Auto assemblers | Cyclical | 6 | 0.82 | 34.3% | 6.0% | 5.5% | ATLH, INDU, MTL |
| Oil and gas exploration | Defensive | 4 | 0.85 | 28.5% | 14.6% | 5.8% | OGDC, MARI, PPL |
| Pharmaceuticals | Cyclical | 7 | 0.86 | 30.9% | -14.9% | 5.2% | GLAXO, ABOT, HALEON |
| Oil and gas marketing | Cyclical | 4 | 0.90 | 33.7% | -17.6% | 4.1% | PSO, APL, SNGP |
| Refineries | Defensive | 4 | 0.96 | 53.0% | 56.3% | 1.6% | ATRL, CNERGY, PRL |
| Commercial banks | Defensive | 15 | 0.98 | 35.5% | 1.8% | 9.9% | UBL, MEBL, MCB |
| Fertilizer | Defensive / quasi-cyclical | 4 | 1.02 | 35.9% | 5.0% | 7.7% | FFC, FATIMA, EFERT |
| Investment companies | Cyclical | 4 | 1.07 | 44.2% | 3.8% | 1.2% | ENGROH, PIAHCLA, DLL |
| Technology | Cyclical | 3 | 1.14 | 38.9% | -24.2% | 1.8% | PTC, SYS, AIRLINK |
| Textile composite | Cyclical | 4 | 1.15 | 44.0% | -3.0% | 1.4% | ILP, KTML, NML |
| Cement | Cyclical | 10 | 1.31 | 45.8% | -7.3% | 1.3% | LUCK, BWCL, FCCL |
Power producers are missing from the table because only two are worth Rs 30 bn or more. Across all 10 power companies in our data, the median beta was 0.82 and the median dividend yield was 11.4%, which fits their usual defensive, income-paying label.
What the data shows
The classic defensive sector behaved defensively. Food and personal care had a median beta of only 0.36 and the lowest volatility of any sector, at 24.8%. On a day the KSE-100 fell 1%, the typical large food company moved about a third as much.
Cement was the most cyclical. With a median beta of 1.31, large cement shares moved about 30% more than the market. Cement demand depends on construction and government development spending, and cement makers carry high fixed costs, so small changes in volume make big changes in profit.
Defensive does not mean safe. Food companies had the lowest beta, yet their median share price fell 13.8% over the year while the KSE-100 rose. Pharmaceuticals, which we label cyclical, fell 14.9%. A low beta tells you a share moves less with the market day to day. It does not protect you from company problems, cost pressure or simply paying too much.
One year can break the labels. Auto assemblers and chemicals moved less with the market than you might expect, and refineries rose 56.3% while the KSE-100 rose 7.8%. Refineries were also the most volatile sector at 53.0%, even though their earnings are defensive over a full cycle: a reminder that sector news can matter more than the label. Beta changes over time, so treat any one-year figure as a snapshot.
How the KSE-100 behaved in interest rate cycles
Interest rates are the biggest driver of Pakistan’s economic cycle, and so of cyclical shares. The table below shows the KSE-100 during each period of rising or falling State Bank of Pakistan (SBP) policy rates since 2018. The dates are approximate, by month, from our rate history; exact decision dates are on the SBP monetary policy page. Index values are closing levels on the first trading day of each month shown.
| Period | Policy rate | KSE-100 at start | KSE-100 at end | Change | Largest fall within period |
|---|---|---|---|---|---|
| Jan 2018 to Aug 2019 | Rising, 5.75% to 13.25% | 40,711 | 31,839 | -21.8% | -32.1% |
| Mar 2020 to Jul 2020 | Falling, 13.25% to 7% | 39,296 | 34,889 | -11.2% | -30.9% |
| Sep 2021 to Jul 2023 | Rising, 7% to 22% | 47,413 | 43,899 | -7.4% | -19.1% |
| Jun 2024 to Jan 2026 | Falling, 22% to 10.5% | 75,575 | 176,355 | 133.4% | -13.0% |
| Apr 2026 to 6 Nov 2026 | Rising, 10.5% to 12% | 155,512 | 173,887 | 11.8% | -13.4% |
The pattern is clear in the long rate cycles. The two big hiking cycles, 2018 to 2019 and 2021 to 2023, were poor periods for the index, and the long cutting cycle from mid-2024 brought one of its strongest rallies. The short 2020 cut was different: it was an emergency response to the COVID-19 crash, and the index fell first. The current rise has been small so far and the index has held up.
For cyclical sectors such as cement, autos and steel, falling rates help twice: cheaper loans lift demand from customers, and lower finance costs lift profits. Banks often work the other way, earning wider margins when rates are high. Our SBP interest rate guide and our article on the KSE-100 macro cycle go deeper into this.
How to use this in your portfolio
- Mix both types. A portfolio of only cement and autos will feel every turn of the cycle. Adding food, power or oil and gas companies can soften the swings.
- Match the mix to your time frame. Money you may need within a year or two is better kept out of the most cyclical sectors.
- Look at the company, not just the sector. Within every sector there are strong and weak balance sheets. Check debt, cash flow and red flags on each company page.
- Remember valuation. A defensive company bought at a very high price can still fall a long way.
You can compare companies within each sector and see every company’s Pulse Score and fair value estimate on the Market Pulse Hub dashboard. The Pulse Score is our estimate of a company’s financial quality and value, scored out of 100 from about 30 checks on its published accounts; fair value is our estimate of what a share is worth based on its earnings and cash flow. Both are estimates, not price targets. Our guide to dividend income in Pakistan is also useful if you are looking for steadier income payers.
Frequently asked questions
Which are the most defensive stocks in Pakistan?
On our labels, the defensive sectors are food and personal care, power producers, tobacco, fertilizer, oil and gas exploration, refineries and banks. In our data, large food and personal care companies had the lowest median beta of any PSX sector over the past year, at 0.36. That describes past price behaviour only and is not a recommendation.
What is a cyclical stock?
A company whose profits rise and fall with the economy and interest rates. On PSX, cement, autos, steel and engineering, textiles, chemicals, technology and pharmaceuticals are examples. Their share prices tend to move more than the market.
Are bank stocks defensive or cyclical?
We label them defensive, with a caveat. Banks are sensitive to interest rates: high rates usually widen their margins, while a weak economy can raise bad loans. Large PSX banks had a median beta of 0.98 over the past year and a median dividend yield of 9.9%.
Do defensive stocks always fall less in a crash?
Usually less, but not always, and not by a fixed amount. In a sharp market-wide sell-off almost everything falls. Defensive companies also face their own risks, such as regulated prices or rising input costs.
What does a beta of 1.3 mean?
It means that, on average, the share moved about 1.3% for every 1% move in the KSE-100 over the period measured. Beta is based on past prices and changes over time.
Want sector and score updates as new results arrive? Join the Market Pulse Hub waitlist.
Figures are from company results, exchange data and our calculations up to 6 November 2026 and will change as new data arrives. This article is for education only and is not investment advice.