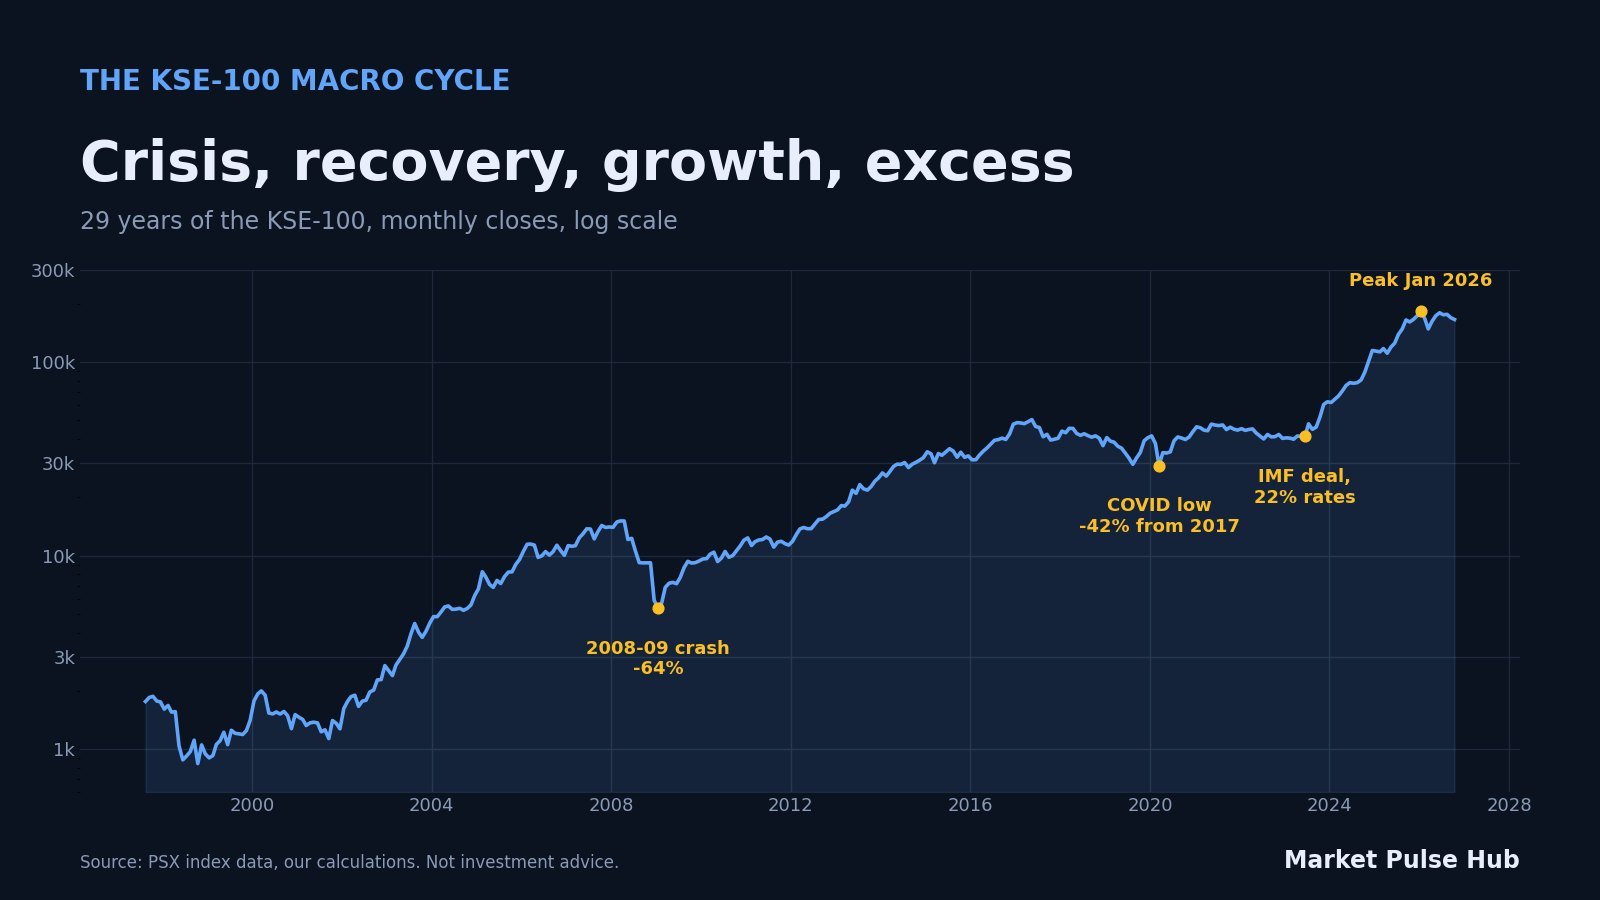
The KSE-100 does not rise in a straight line. Over the last three decades it has moved through repeated cycles of crisis, recovery, profit growth and excess, and each turn has been driven by the same few forces: foreign financing, inflation and interest rates. This guide explains the four stages of the KSE-100 cycle, what 29 years of data show about past cycles and calendar months, and where the main signals stand in November 2026.
Key points
- Since FY2000 the KSE-100 has risen in 19 of 26 fiscal years, but its two deepest falls were 64% (2008 to 2009) and 42% (2017 to 2020) on month-end closes.
- In the last cycle the market rose 83% between June 2023 and May 2024, while the State Bank of Pakistan (SBP) policy rate was still 22%. Stocks priced in the IMF deal long before the first rate cut.
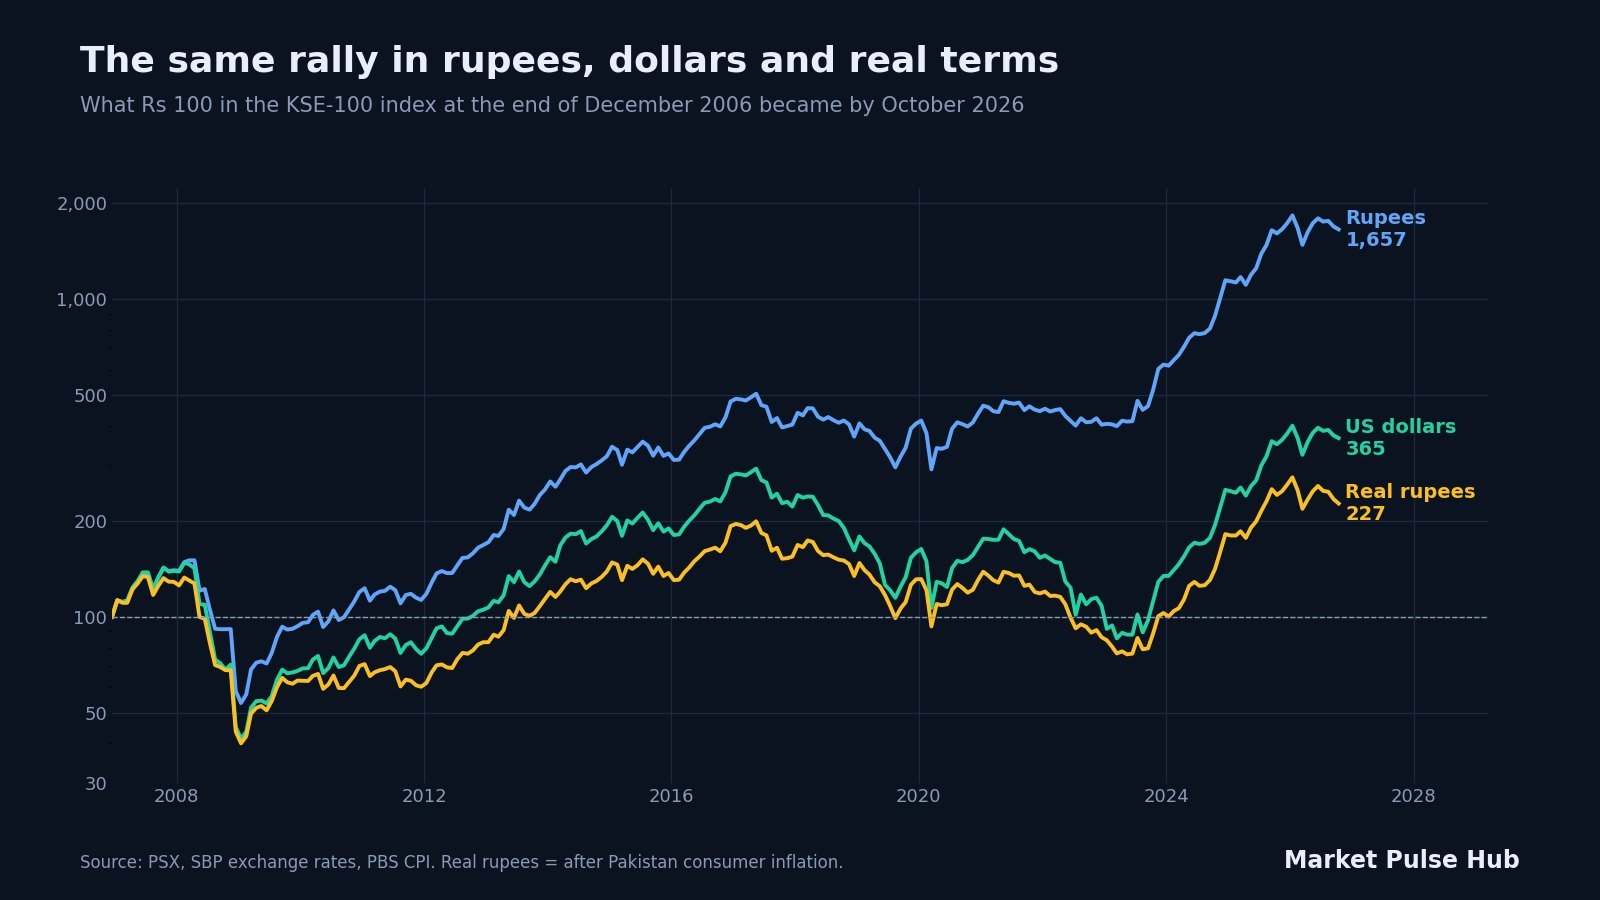
- In rupees, Rs 100 in the index at the end of 2006 grew to about Rs 1,657 by October 2026. In US dollars it was worth about 365, and after Pakistan inflation about 227.
- In November 2026 the signals are mixed: valuations are moderate at about 7.2 times earnings and reserves are much stronger, but the SBP has started raising rates again and oil prices are high.
The four stages of the KSE-100 cycle
Pakistan’s stock market is very sensitive to the balance of payments. When dollars run short, the rupee weakens, inflation rises, the SBP raises rates and share prices fall. When financing arrives, the process reverses. A simple four-stage framework helps organise the signals, although stages can overlap, stall or reverse and no cycle follows a fixed timetable.
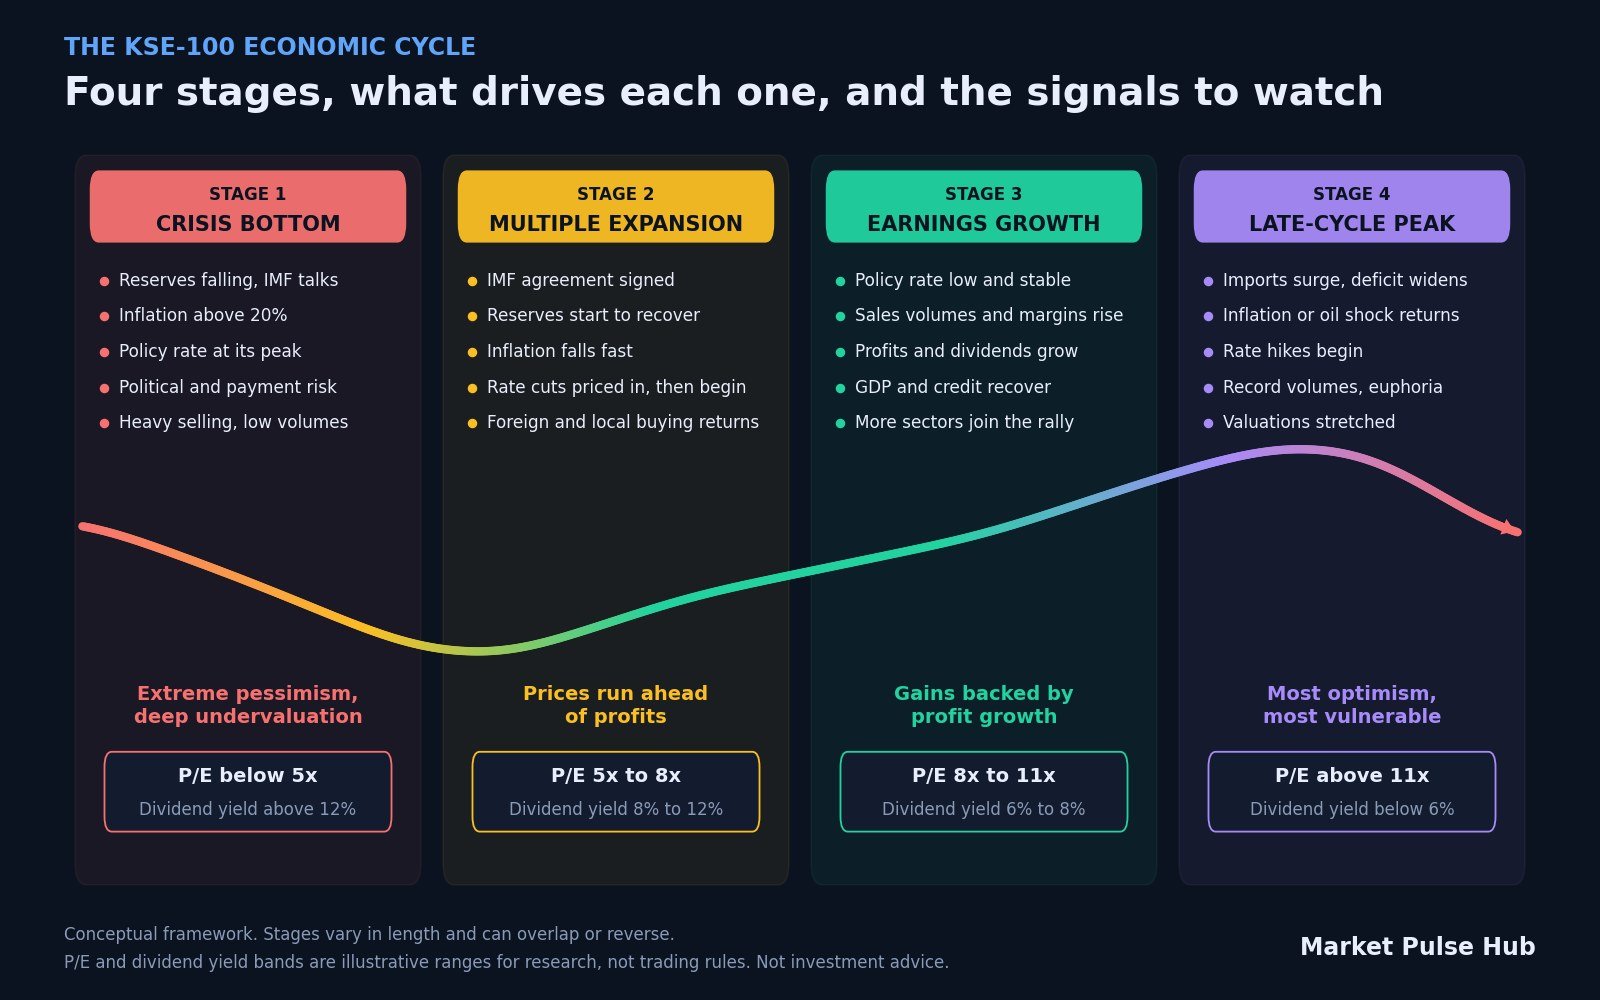
- Crisis trough. Reserves are low, an IMF programme is being negotiated and interest rates are at or near their peak. Shares trade at very low multiples of earnings because investors doubt the country can pay its bills.
- Multiple expansion. Financing is secured, reserves recover and inflation starts to fall. Investors are willing to pay more for each rupee of profit, so prices rise faster than earnings. This is usually the sharpest part of a rally.
- Earnings growth. Lower rates and stable currency feed into sales volumes, margins and dividends. Price gains now need profit growth behind them, and more sectors join the rally.
- Late-cycle risk. Valuations are higher, imports grow, the current account deficit widens and inflation or an oil shock forces rates up again. The next crisis builds here.
What 26 fiscal years of KSE-100 returns show
Measuring from one June close to the next gives a consistent view of the long history. The index rose in 19 of 26 fiscal years since FY2000, often by 30% or more, but the bad years were severe and tended to come in clusters.
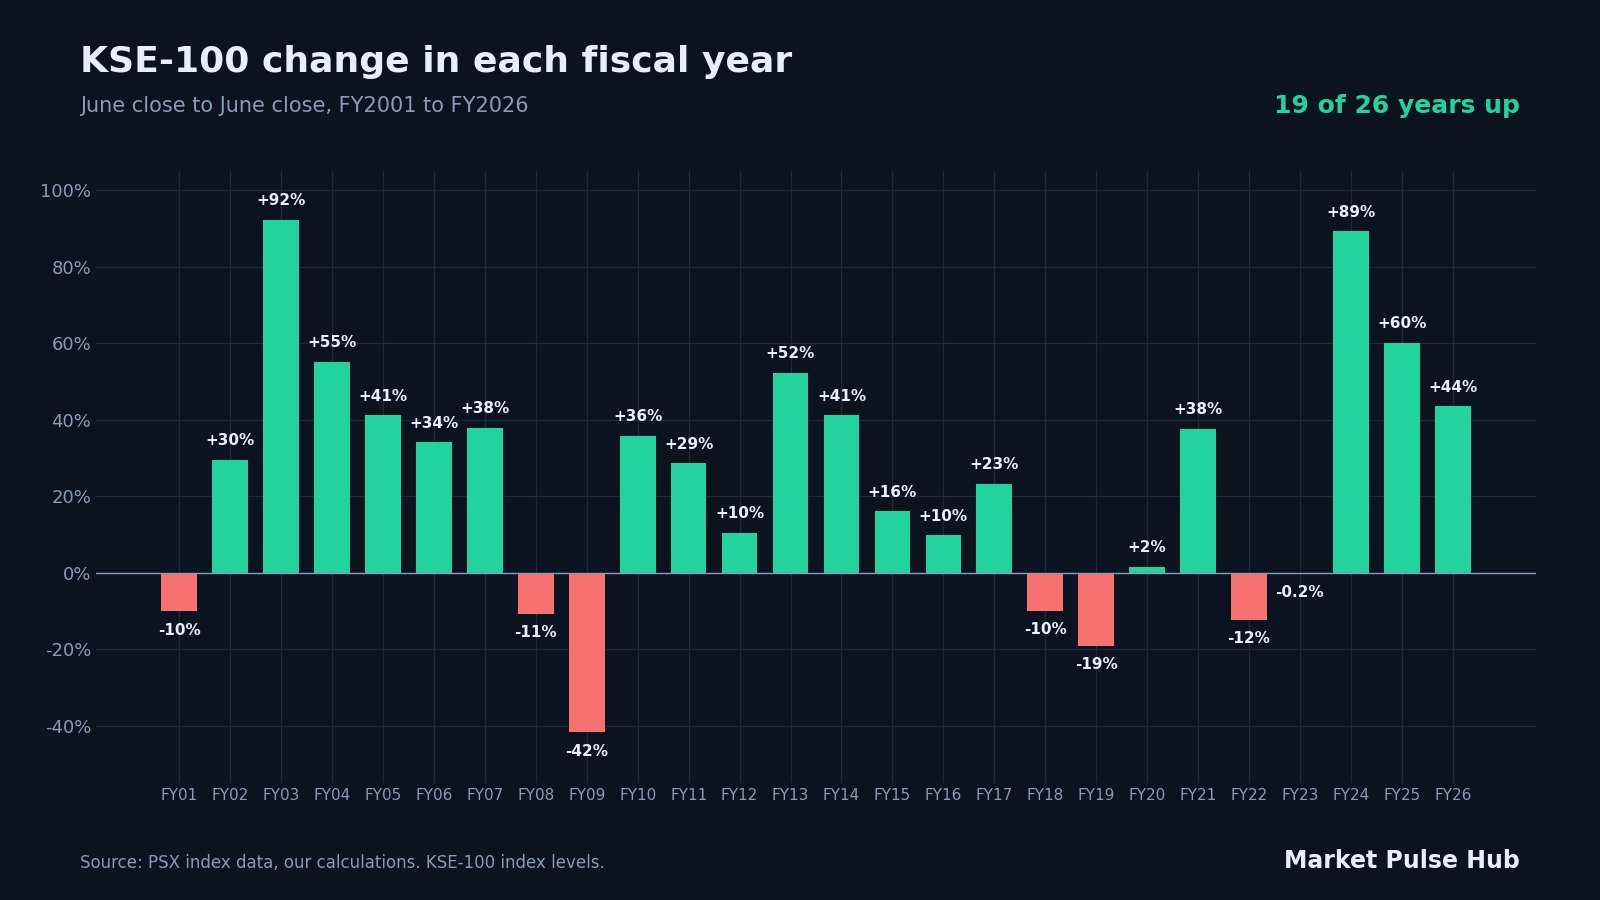
The strongest years came straight after a crisis: +92% in FY2003, +52% in FY2013 and +89% in FY2024. The weakest came at the end of long booms or during external crises: -42% in FY2009 and back-to-back falls in FY2018 and FY2019. FY2023 ended almost exactly where it started (-0.2%), the calm before one of the strongest rallies in the index’s history.
| Fiscal year | June close | Change |
|---|---|---|
| FY2017 | 46,565 | +23.2% |
| FY2018 | 41,911 | -10.0% |
| FY2019 | 33,902 | -19.1% |
| FY2020 | 34,422 | +1.5% |
| FY2021 | 47,356 | +37.6% |
| FY2022 | 41,541 | -12.3% |
| FY2023 | 41,453 | -0.2% |
| FY2024 | 78,445 | +89.2% |
| FY2025 | 125,627 | +60.1% |
| FY2026 | 180,302 | +43.5% |
Three long cycles since 2000
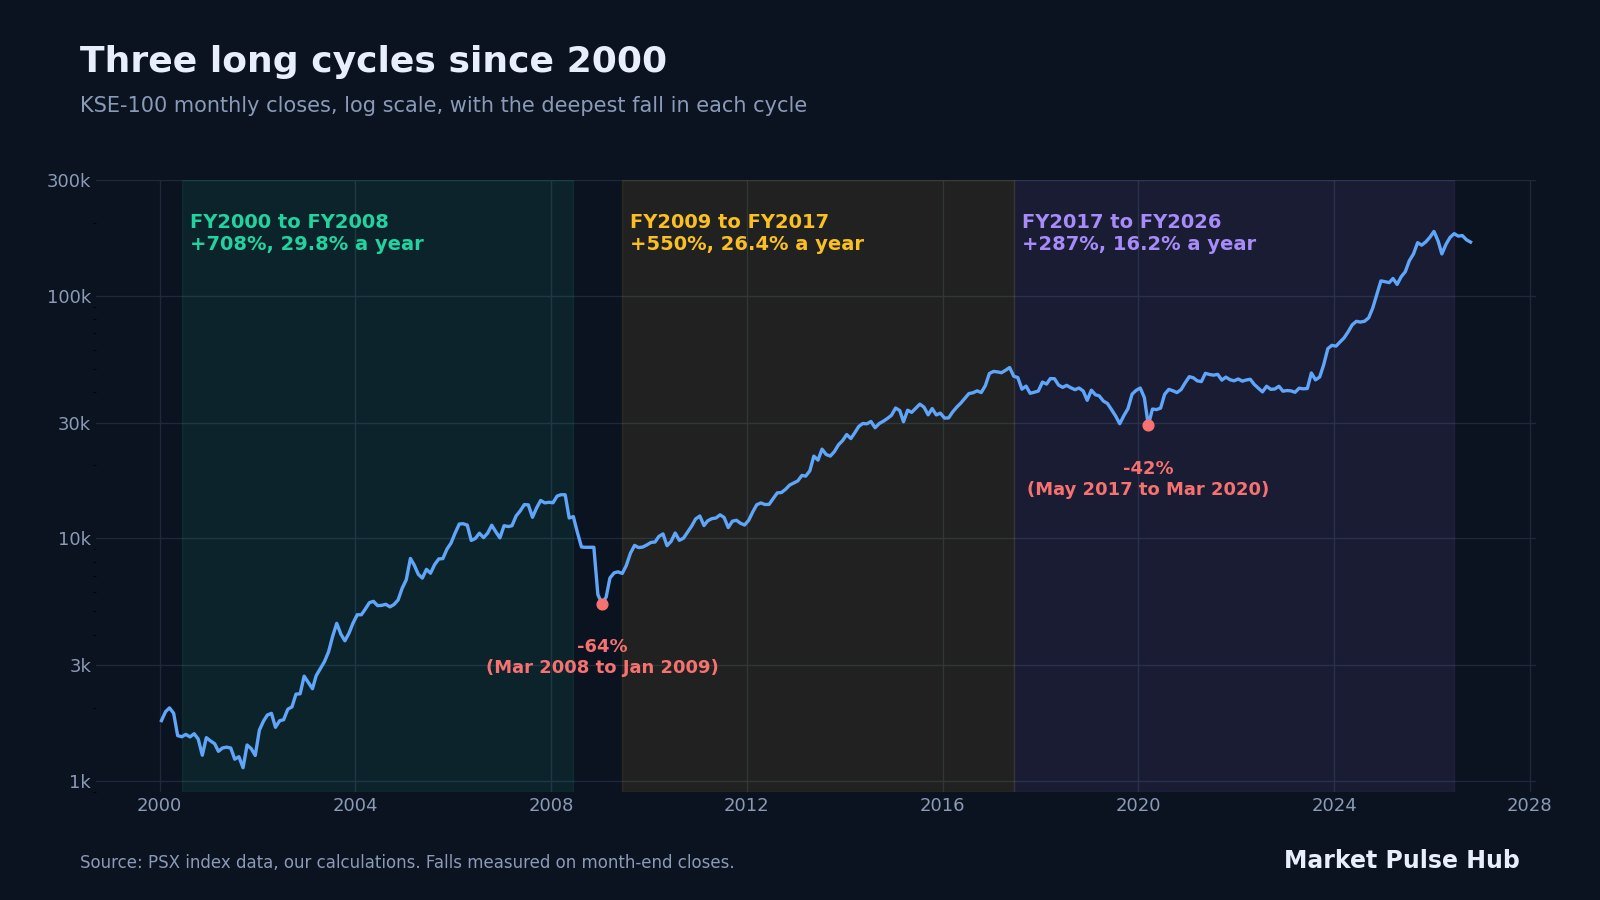
Grouping the history into three long windows shows how different each cycle was, even though each lasted eight or nine years.
| Window | KSE-100 | Total change | Per year | What happened |
|---|---|---|---|---|
| FY2000 to FY2008 | 1,521 to 12,289 | +708% | 29.8% | A long boom that ended in the 2008 crisis. The exchange imposed a price floor in 2008, and by January 2009 the index was 64% below its March 2008 high. |
| FY2009 to FY2017 | 7,162 to 46,565 | +550% | 26.4% | Recovery under an IMF programme, falling rates and steady earnings growth. The index then fell 42% between May 2017 and March 2020. |
| FY2017 to FY2026 | 46,565 to 180,302 | +287% | 16.2% | Six flat years, a balance of payments crisis in 2022 and 2023, then a 335% rise from FY2023 to FY2026 concentrated at the end of the window. |
The lesson is not that the market repeats every eight to ten years. The windows are our own grouping, and the path inside each was very different. The useful pattern is the sequence: external stress, financing, falling inflation and rates, then earnings. Investors who watch that sequence do not need to guess a date.
The 2023 to 2026 rally: the market moved before rates fell
The most recent cycle is a clear example of stage 2. In June 2023 reserves were critically low, inflation had peaked near 38% and the policy rate was 22%. Within weeks the IMF reached a staff-level agreement on a nine-month Stand-By Arrangement, which the IMF Board approved on 12 July 2023.
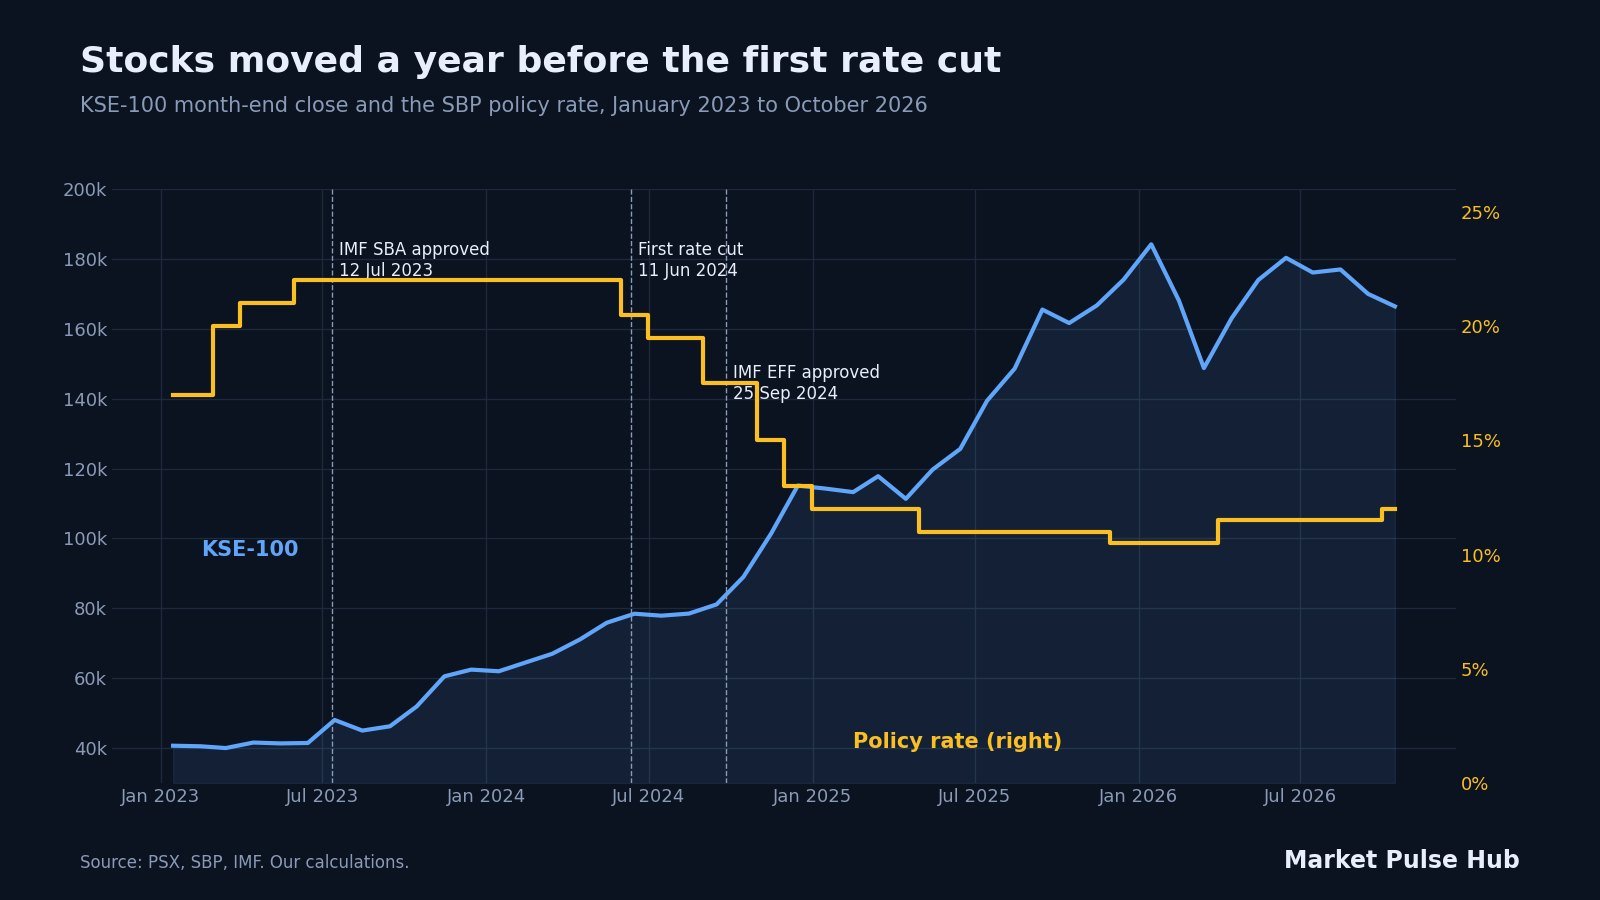
- June to December 2023: the KSE-100 rose 50.7%, from 41,453 to 62,451, while the policy rate stayed at 22%.
- June 2023 to May 2024: the index rose 83% before the SBP’s first cut took effect on 11 June 2024.
- September 2024: the IMF Board approved a 37-month Extended Fund Facility. Rate cuts accelerated, and the policy rate reached 12% in January 2025 and 10.5% in December 2025.
- January 2026: the index set a record close of 189,167 on 23 January, before the cycle began to show late-stage pressure.
Investors who waited for the first rate cut missed most of the first leg of the rally. That does not mean the IMF deal alone caused it: lower valuations, earnings and a change in risk appetite all played a part. But the order of events matches past cycles. Financing first, prices second, rate cuts third.
Source documents: IMF SBA approval, SBP rate decision of June 2024, IMF EFF approval.
Interest rates and inflation: the engine of the cycle
The SBP sets its policy rate mainly in response to inflation, and the gap between the two decides whether savers earn a real return in bank deposits and government paper. When the real rate is deeply negative, as in 2008 and again in 2022 and 2023, the economy is under stress and the next move in rates is usually up. When inflation falls well below the policy rate, there is room for cuts, which supports share prices.
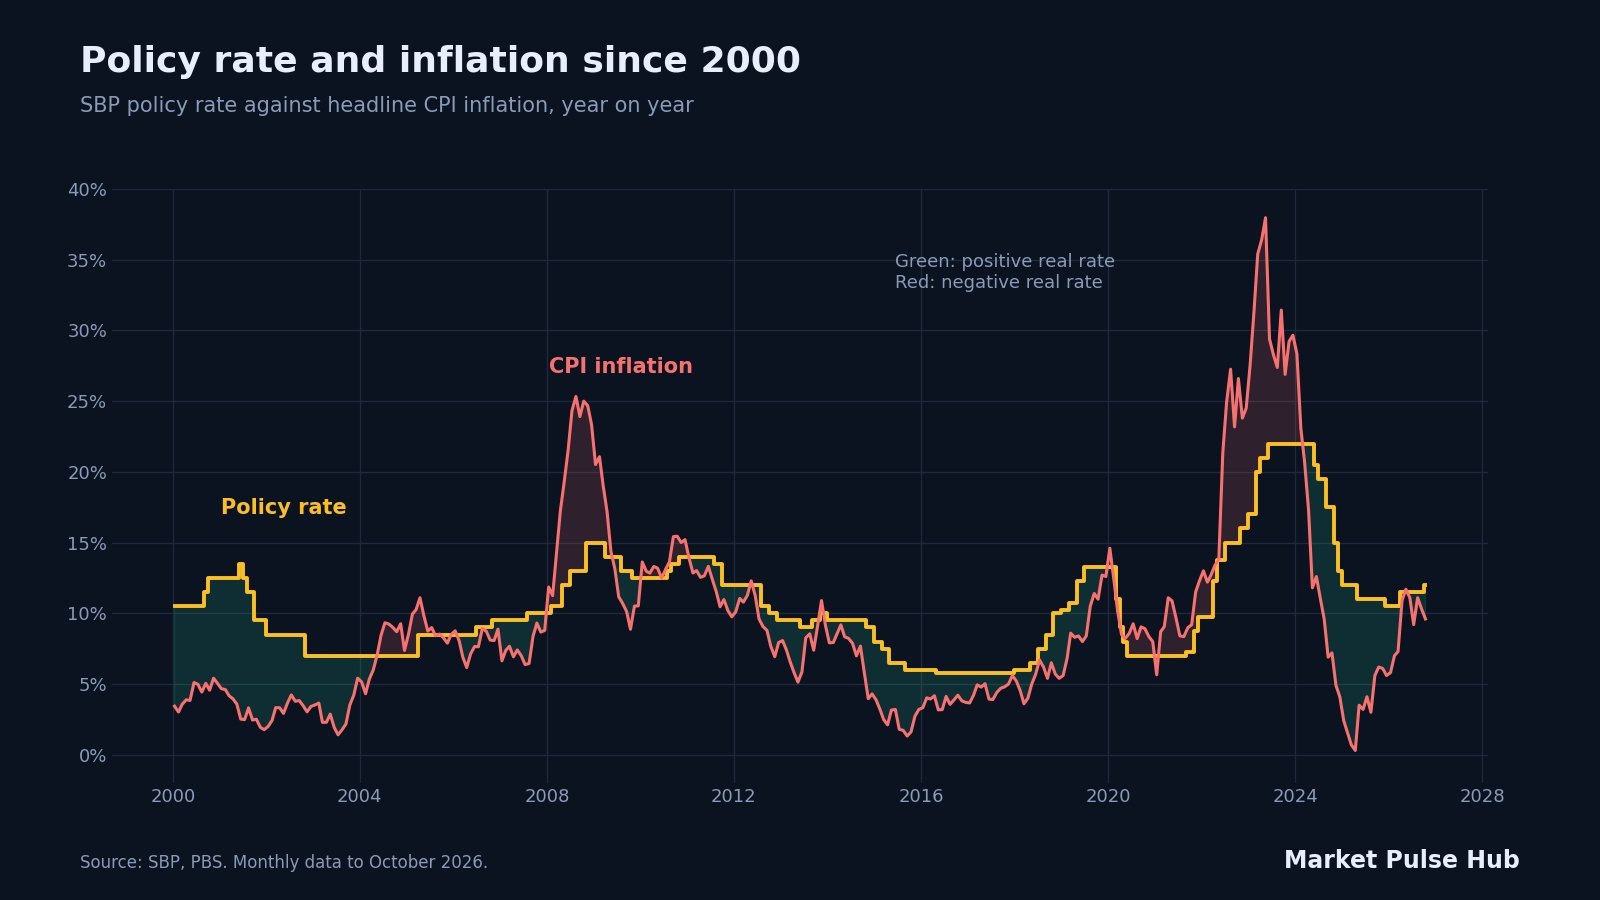
In 2025 inflation fell to very low levels, at one point below 1%, and the policy rate was cut to 10.5%. Since then inflation has come back: it was 11.1% in June 2026 and 9.6% in October 2026. The SBP raised the rate to 11.5% in April 2026 and to 12% in October 2026. For the full history see our Pakistan interest rate history and Pakistan inflation history pages.
The external account decides when cycles turn
Every major KSE-100 crisis this century came with falling reserves and a large current account deficit. The rolling 12-month current account reached a deficit of almost $20 billion in 2018 and more than $17 billion in 2022, and both times the market fell hard. Liquid reserves dropped to about $8.2 billion in January 2023, with the SBP’s own share near $3 billion in early February 2023.
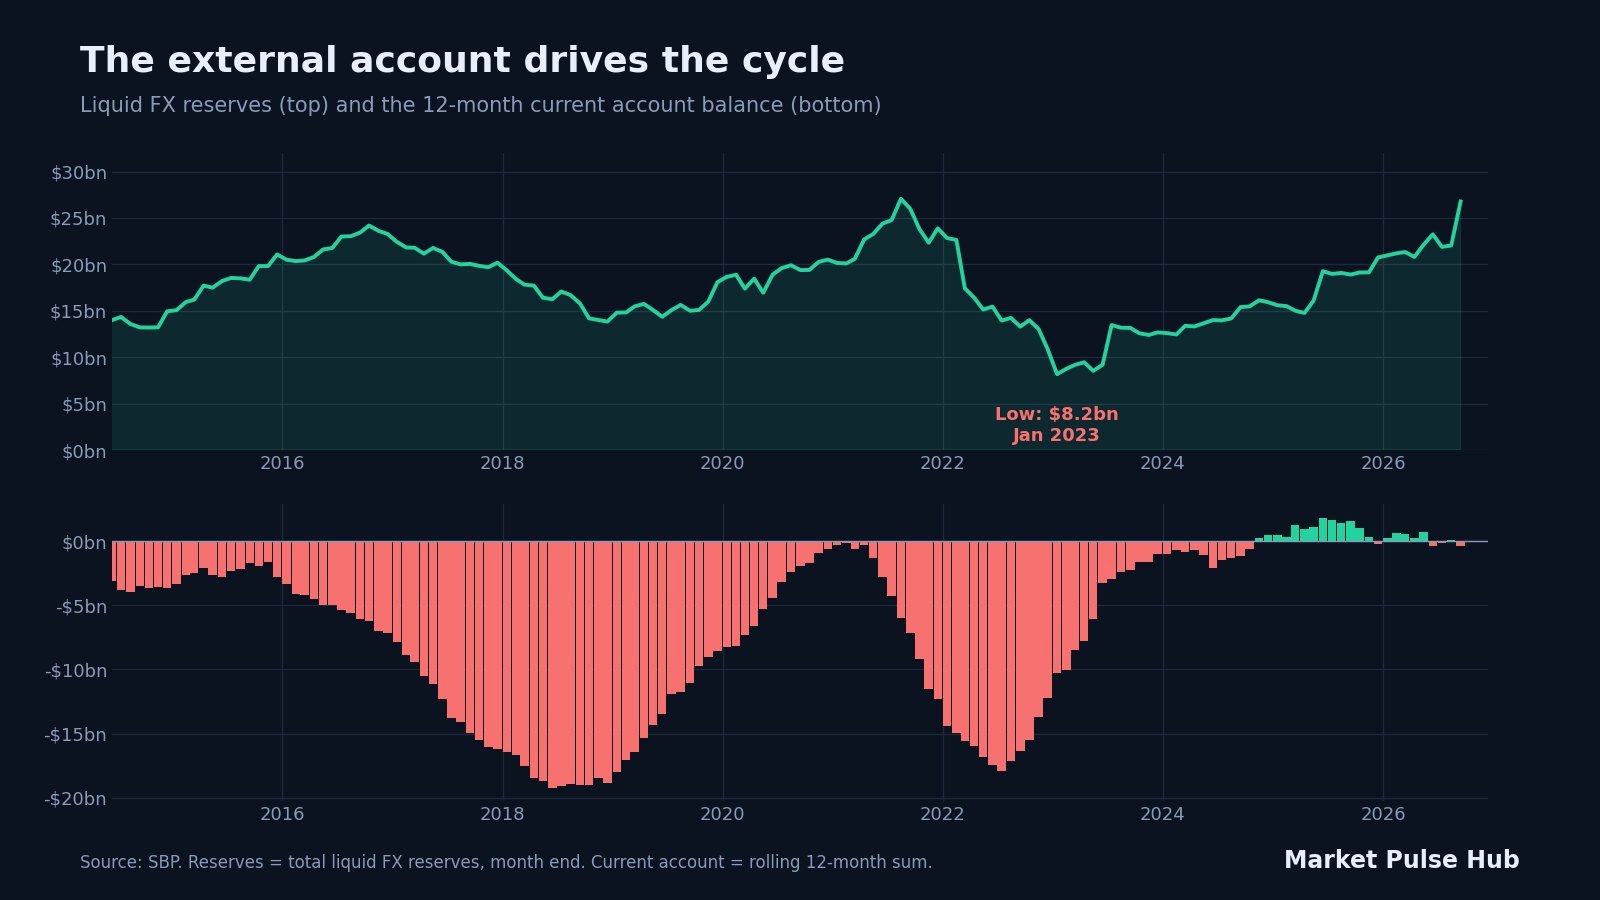
Today the picture is very different. Total liquid reserves were about $26.8 billion in September 2026 and SBP-held reserves were $21.56 billion on 30 October 2026. The current account was close to balance over the 12 months to September 2026, at a deficit of about $0.37 billion, although September alone showed a $356 million deficit. A widening deficit is one of the clearest late-cycle warnings, so this is the line to watch in the coming months.
Rupees, dollars and real returns
Headline index gains overstate what investors kept, because the rupee lost value and prices rose. The chart shows Rs 100 invested in the KSE-100 index at the end of December 2006.
| Measure, Dec 2006 to Oct 2026 | Rs 100 became | Per year |
|---|---|---|
| Rupees | 1,657 | 15.2% |
| US dollars | 365 | 6.7% |
| After Pakistan inflation | 227 | 4.2% |
In real terms, the investment was below its starting value for long stretches, including 2008 to 2013 and again in 2022 and 2023. Almost all of the real gain came in the latest cycle. This is why entry point matters so much in Pakistan, and why the cycle framework is worth understanding. To compare with gold or inflation from any month you choose, try our gold vs KSE-100 calculator and inflation calculator.
KSE-100 seasonality: what calendar months tell us
Once the bigger picture is clear, some investors use the calendar to time purchases. We measured every monthly change in the KSE-100 from August 1997 to October 2026, which gives 29 or 30 observations for each month.
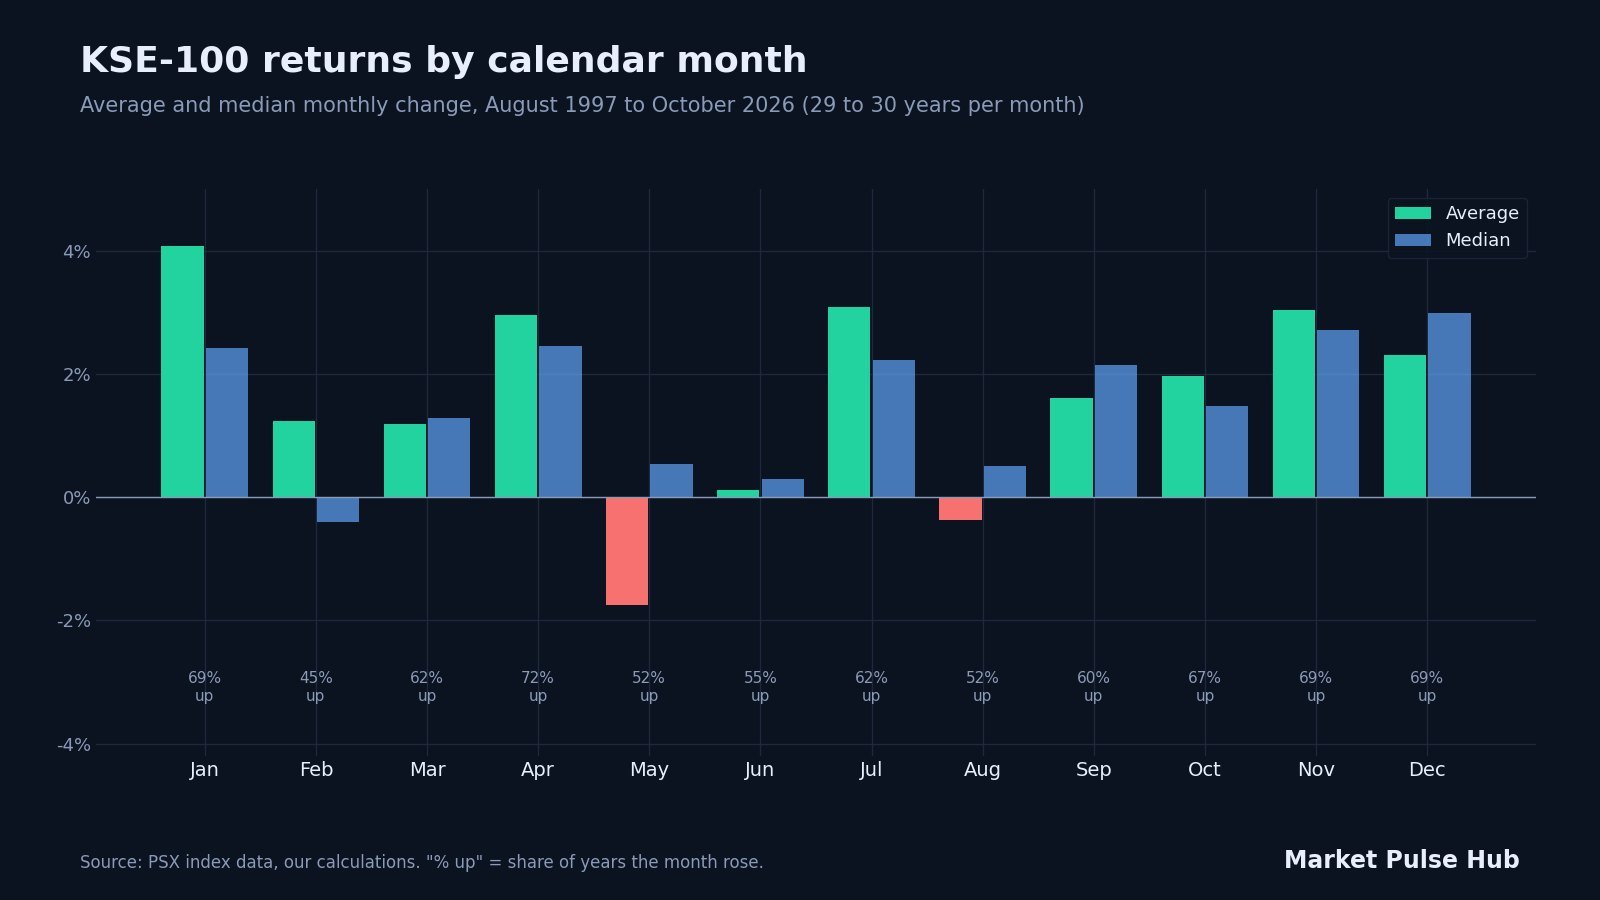
- Strongest months: January (average +4.1%, up in 69% of years), April (+3.0%, up in 72%), July (+3.1%) and November (+3.0%, up in 69%).
- Weakest months: May averaged -1.8%, pulled down by a few large falls, though its median was slightly positive. February rose in only 45% of years. June was close to flat on average, often a month of caution before the federal budget.
- The second half: September to December has been positive on average in every month, with medians between 1.5% and 3.0%.
Seasonal averages are a weak signal next to the macro cycle. A single crisis month can outweigh years of seasonal gains, and patterns can disappear once enough investors trade on them. Use them for timing within a decision you have already made, not as a reason to buy or sell. Our seasonality and returns dashboard shows the same data by month and year.
Where the KSE-100 cycle stands in November 2026
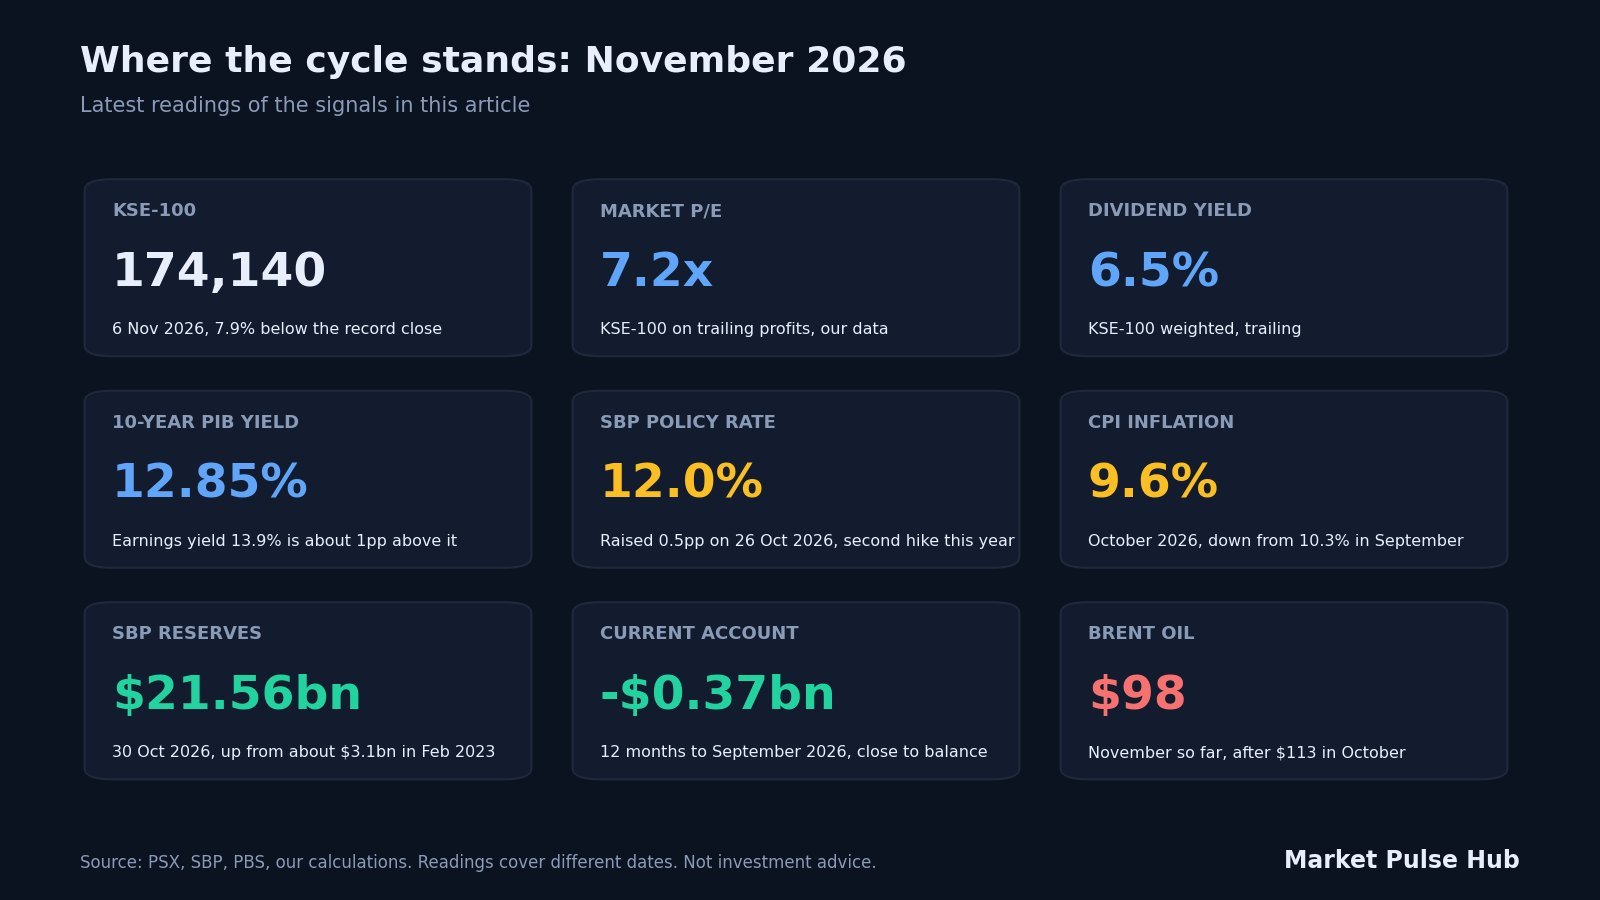
The evidence points to a market that has moved past the explosive stage 2 recovery and is now between stages 3 and 4. On valuation alone, a P/E near 7x would still sit in the stage 2 band of the framework above, but the macro signals look later in the cycle: inflation has returned and the SBP is raising rates again. When valuation and macro signals disagree like this, it pays to watch which side changes first.
- Supportive: reserves are the strongest in years, the current account is near balance, and valuations are moderate. On our data the KSE-100 trades at about 7.2 times trailing profits, which is an earnings yield of about 13.9%, roughly one percentage point above the 12.85% ten-year government bond yield. The weighted dividend yield is about 6.5%.
- Warning signs: inflation has returned to around 10%, the SBP has raised rates twice in 2026, Brent oil was about $113 in October, and the index closed on 6 November 2026 at 174,140, about 8% below its January record.
Rising rates with moderate valuations do not by themselves mean a crash. In past cycles, the market’s worst falls came when tighter policy met a widening current account deficit and falling reserves. That combination is not present today, so the key things to watch are the monthly current account, the next SBP decisions and whether company profits keep growing. Our Pakistan economy dashboard tracks these indicators every month.
Signals to track before adding or trimming
| Indicator | Early-recovery sign | Late-cycle warning |
|---|---|---|
| Market P/E | Very low multiples with earnings estimates stabilising | Multiples well above the long-run range while earnings stall |
| Dividend yield vs 10-year bond | Dividend yield close to or above bond yields | A wide gap in favour of bonds |
| Policy rate and inflation | Rates on hold after tightening, inflation falling | Inflation rising again and rate hikes |
| IMF programme | Staff agreement, Board approval and disbursement | Delayed reviews or financing gaps |
| Current account and reserves | Deficit shrinking, reserves rising | Deficit widening for several months, reserves falling |
| Foreign and local flows | Local institutions and foreigners both buying | Persistent selling by institutions |
Treat these as a checklist rather than precise trigger levels. Check two or more independent signals before acting, and record what you knew at the time so you can judge your decisions later. For flows, read our guide to FIPI and LIPI investor flows.
How investors use the cycle in practice
- Build positions in steps. An IMF staff agreement, Board approval and a rise in reserves are separate checkpoints. Adding in stages lets you reassess the price and the story at each one.
- Check the sector story against results. Banks are sensitive to rate cuts through their margins, while cement, steel and autos depend on volumes and financing costs. Exporters respond differently to a weaker rupee than importers.
- Ask why the P/E changed. A higher ratio can come from rising prices or falling profits, and the two mean very different things.
- Compare with the alternative. When government bond yields are well above the market’s dividend yield and rates are rising, the case for holding more cash or fixed income gets stronger. Long-dated bonds can also lose value if rates keep rising.
- Keep a long horizon. The index did recover from the falls of 2008 and 2017 to 2020, but it took about four and a half years to regain the March 2008 high and more than six years to regain the May 2017 high.
Frequently asked questions
Does the KSE-100 follow an 8 to 10 year cycle?
Three long cycles since 2000 each lasted about eight to nine years, but that is partly how the windows are drawn. The timing has varied a lot, so it is more useful to watch the sequence of signals (financing, inflation, rates and earnings) than to count years.
Why did the KSE-100 rise in 2023 when interest rates were 22%?
The IMF approved a new programme in July 2023, which removed the immediate risk of default. Investors priced in falling inflation and future rate cuts, so the index rose 83% between June 2023 and May 2024, before the first cut took effect on 11 June 2024.
What is the best month to invest in the KSE-100?
Between 1997 and 2026, January, April, July and November had the highest average returns, and May and February were the weakest. These patterns are not reliable enough to use on their own; the economic cycle matters far more.
Is the KSE-100 expensive in November 2026?
On our data the index trades at about 7.2 times trailing profits with a dividend yield of about 6.5%. That is a moderate multiple, but rising rates and higher oil prices mean the earnings outlook needs close watching.
Does the KSE-100 include dividends?
Yes. The KSE-100 is a total return index, so its level assumes dividends are reinvested. PSX also publishes KSE100PR, a price return version without dividends, as explained in its index brochure.
Follow the indicators in this article on the free Market Pulse Hub dashboard, and join the waitlist to get new tools and reports first.
Figures are from PSX, SBP, PBS and IMF data and our calculations up to 6 November 2026 and will change as new data arrives. Stage descriptions and signal ranges are a framework for research, not trading rules. This article is for education only and is not investment advice.