The Pakistan economy in October 2026 sent mixed signals. Headline inflation eased to 9.6% year on year in October, down from 10.3% in September, yet the State Bank of Pakistan (SBP) raised the policy rate by 50 basis points to 12% on 26 October. Tax collection fell well short of target, with the FBR collecting about Rs 974 bn in October against a Rs 1,132 bn goal, while the KSE-100 slipped 2.1% over the month. Here is what the data says, what our dashboard model reads from it, and how PSX sectors performed.
Inflation and interest rates
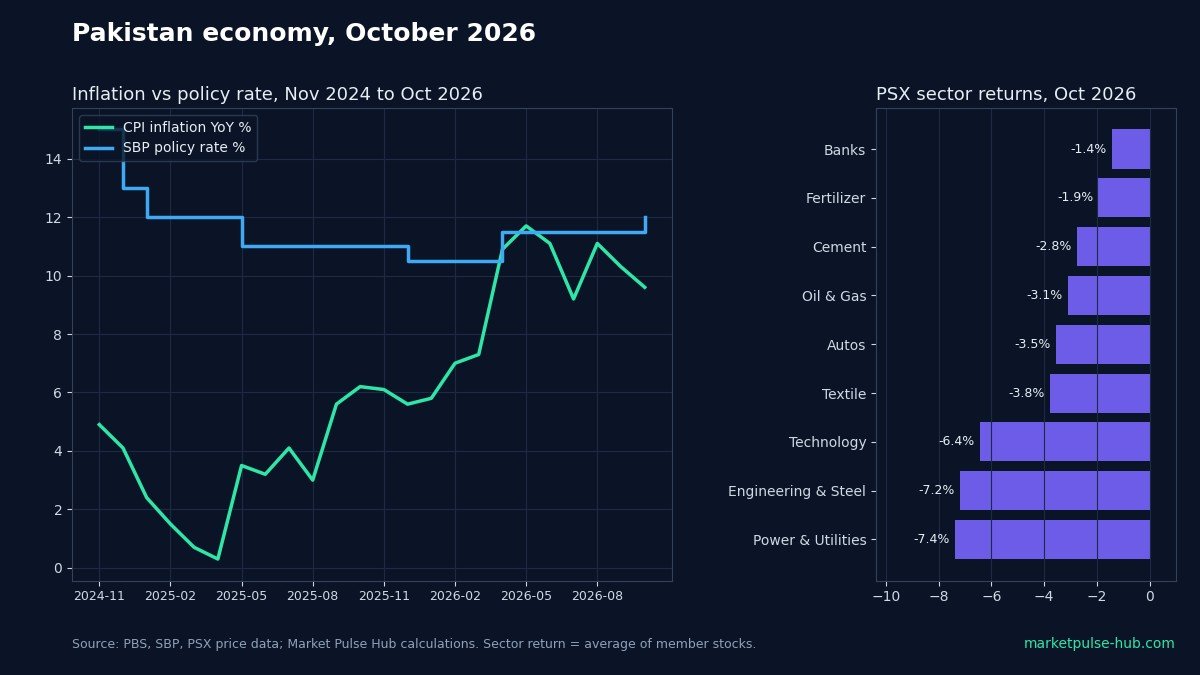
Consumer price inflation (CPI) was 9.6% year on year in October 2026, according to the Pakistan Bureau of Statistics, the second straight monthly decline after 11.1% in August and 10.3% in September. Prices still rose 1.1% month on month in October (CPI index 307.62 against 304.33 in September), so the cost of living is still climbing quickly, just a little more slowly than before. Wholesale prices are a warning sign: the WPI rose 13.79% year on year in October, up from 13.33% in September, which suggests cost pressure in the pipeline.
The SBP Monetary Policy Committee raised the policy rate from 11.5% to 12% on 26 October 2026. With CPI at 9.6%, the real policy rate (policy rate minus inflation) is about 2.4 percentage points positive. The latest 10-year PIB cut-off yield was 12.85% at the 7 October 2026 auction, up from 12.5% in September. That leaves the 10-year yield only about 0.85 points above the policy rate, a fairly flat curve. If you want to understand how rate moves feed into share prices, read our SBP interest rate stocks guide.
Trade, reserves and the rupee
October trade data had not been posted on the PBS website when we checked. Samaa TV, quoting official documents on 3 November 2026, reported that Pakistan’s October 2026 trade deficit was $4.07 bn, with exports of $2.94 bn and imports of just over $7 bn. That took the July to October deficit to $14.63 bn. For comparison, the September 2026 deficit in our PBS data was Rs 988 bn. Treat the October figure as provisional until PBS publishes its release, which the economic calendar lists for 6 November.
Total liquid foreign exchange reserves were $26.77 bn at the end of September 2026 (SBP). The SBP’s latest weekly figure available at the time of writing, for the week ended 23 October 2026, showed SBP-held reserves of $21.52 bn and total liquid reserves of $26.75 bn, as reported by The Express Tribune. The end-October weekly figure was not yet released at the time of writing.
The rupee was steady. USD/PKR ended October 2026 at 276.44, slightly stronger than 276.83 at the end of September and 280.70 a year earlier. The October real effective exchange rate (REER) was not yet released at the time of writing. The latest SBP reading, for September 2026, was 108.93, well above the 10-year average of 102.44. A REER above 100 means the rupee is overvalued in real terms against trading partners, which can hurt export competitiveness. Oil adds pressure: Brent was about $113 a barrel in October in our data, up from about $98 in September.
Tax collection and activity
The FBR collected about Rs 974 bn in October 2026 against a monthly target of Rs 1,132 bn, a shortfall of Rs 158 bn or roughly 14%, according to provisional figures reported by Profit on 31 October. For July to October the collection was about Rs 4.06 trn, Rs 124 bn below target.
Cement despatches, a good real-time read on construction, were 4.81 mn tons in October 2026, up 0.4% from 4.79 mn tons a year earlier (APCMA). Domestic despatches rose 1.2% to 4.04 mn tons and exports were about 0.77 mn tons. Large-scale manufacturing (LSM), the latest available, grew 0.7% year on year in August 2026 after 3.0% in July. The latest GDP figure shows growth of 2.0% for the quarter to June 2026, slower than 4.4% in the quarter to March.
Broad money (M2) for end-October was not yet released at the time of writing. In September 2026 M2 stood at about Rs 46.36 trn, up 12.1% year on year, which is about 1.8 points faster than inflation that month.
Leading indicators
Our Market Pulse Hub dashboard tracks six leading indicators for Pakistan. Here are the live readings when this article was written:
| Indicator | Latest reading | Signal |
|---|---|---|
| Consumer confidence | 36.6 (Sep) vs 12-month average 38.4 (-4.7%) | Neutral |
| Industrial output (LSM) | +0.7% YoY (Aug), 3-month average +0.1% | Neutral |
| Money supply (M2) | +12.1% YoY (Sep) vs CPI 10.3%: real +1.8% | Neutral |
| Yield curve | 10Y PIB 12.85% minus policy rate 12% = +0.85 pts (flat) | Neutral |
| Cement despatches | Domestic +1.2% YoY (Oct), 4.041 mn t | Neutral |
| Currency valuation (REER) | 108.9 (Sep) vs 10-year average 102.44: rupee overvalued | Negative |
With five neutral readings and one negative, the model’s overall tilt is NEGATIVE. Consumer confidence for October was not yet released at the time of writing, so the model still uses September’s 36.6.
The model places the economy in a DISINFLATION regime. It looks at two trends: growth and inflation. Growth is slowing (GDP growth of 2.0% in the quarter to June versus 4.4% before, and LSM barely above zero on a three-month average), and inflation is easing (the three-month CPI average dipped to about 10.3% from 10.7%). In this regime the model leans toward stable, income-producing businesses over cyclical ones. This is the model’s reading of current data, not a forecast.
Sectors
The dashboard’s favoured side is currently the defensive and rate-sensitive group (banks, oil and gas, fertilizer and power), because of the disinflation regime and because the KSE-100 is in a RISK OFF zone on our model. October’s sector returns lined up with that reading: the defensive groups held up better than growth sectors such as technology and engineering, although power was the exception.
| Rank | Sector | Model side | Avg return, Oct 2026 |
|---|---|---|---|
| 1 | Banks | Defensive / rates | -1.4% |
| 2 | Fertilizer | Defensive / rates | -1.9% |
| 3 | KSE-100 index | Benchmark | -2.1% |
| 4 | Cement | Growth | -2.8% |
| 5 | Oil & Gas | Defensive / rates | -3.1% |
| 6 | Autos | Growth | -3.5% |
| 7 | Textile | Growth | -3.8% |
| 8 | Technology | Growth | -6.4% |
| 9 | Engineering & Steel | Growth | -7.2% |
| 10 | Power & Utilities | Defensive / rates | -7.4% |
Sector return is the simple average of the member stocks’ price change from the last close of September to the last close of October 2026. The KSE-100 closed October at 166,409, down 2.1% for the month. Within sectors the spread was wide. Among banks, MCB rose 1.9% while BOP fell 6.6%. In fertilizer, FFC gained 3.4% but FATIMA dropped 8.7%. In autos, GHNI rose 7.7% while SAZEW fell 18.0%. Power was weighed down by NPL (-15.3%) and KAPCO (-9.5%).
Investor flows. NCCPL data show foreign investors (foreign corporates, foreign individuals and overseas Pakistanis) were net sellers of about Rs 19.7 bn (roughly $71 mn) in October 2026, led by foreign corporates at about Rs 22.8 bn of net selling. Mutual funds were also net sellers of about Rs 12.1 bn. On the buying side, other organisations bought a net Rs 14.5 bn, local individuals Rs 11.9 bn, banks and DFIs Rs 4.4 bn and companies Rs 4.3 bn. By sector, foreign selling was heaviest in banks (about Rs 6.2 bn net sold) and cement (Rs 0.8 bn), while technology (Rs 0.4 bn) and power (Rs 0.2 bn) saw small net foreign buying. Learn more in our explainer What is FIPI and LIPI?
What to watch next month
- October trade balance (PBS): listed for 6 November 2026. It will confirm or revise the $4.07 bn deficit reported in the media.
- November CPI (PBS): listed for 2 December 2026. October’s reading was 9.6% YoY and 1.1% MoM. Watch whether the wholesale price trend starts to feed into consumer prices.
- SBP policy meeting: the next date is not yet listed in our calendar. After the October hike, any move will show whether the SBP sees the hike as a one-off.
- Weekly SBP reserves, end-October M2, October REER and consumer confidence: these were not yet released at the time of writing and will update the dashboard indicators.
For last month’s picture, see Pakistan Economy in September 2026.
Frequently asked questions
What was Pakistan’s inflation rate in October 2026?
CPI inflation was 9.6% year on year in October 2026, down from 10.3% in September. Prices rose 1.1% from September to October.
Why did the SBP raise interest rates if inflation fell?
The SBP raised the policy rate to 12% on 26 October 2026. Its policy statement gives the official reasons, but two pressures stand out in the data: wholesale inflation was rising (13.79% in October) and Brent oil was much higher in October in our data, both of which can push consumer prices up later. The higher rate keeps the real interest rate positive, at about 2.4 points.
Is the Pakistani rupee overvalued?
By the REER measure, yes. The September 2026 REER was 108.93, above its 10-year average of 102.44. The October reading was not yet released at the time of writing.
What does a disinflation regime mean for PSX investors?
It means growth and inflation are both slowing. In our model this regime points to defensive and rate-sensitive sectors such as banks, oil and gas, fertilizer and power. It describes the current data, not what will happen next.
Were foreign investors buying or selling Pakistani stocks in October 2026?
Selling. NCCPL data show net foreign selling of about $71 mn (Rs 19.7 bn) in October, mostly by foreign corporates, while local individuals, companies and banks were net buyers.
Want these indicators, sector tilts and investor flows updated for you every week? Join the waitlist at marketpulse-hub.com/join.
Bilal, Market Pulse Hub
Figures are from official releases, exchange data and our calculations up to 5 November 2026 and will change as new data arrives. This article is for education only and is not investment advice.