OGDC vs PPL is one of the most common comparisons on the Pakistan Stock Exchange: both are large, state-controlled oil and gas explorers, both pay regular dividends and both sit near the top of the KSE-100. This guide compares them side by side with the other two listed exploration and production (E&P) companies, MARI and POL, using prices, ratios and quarterly reports up to 3 November 2026.
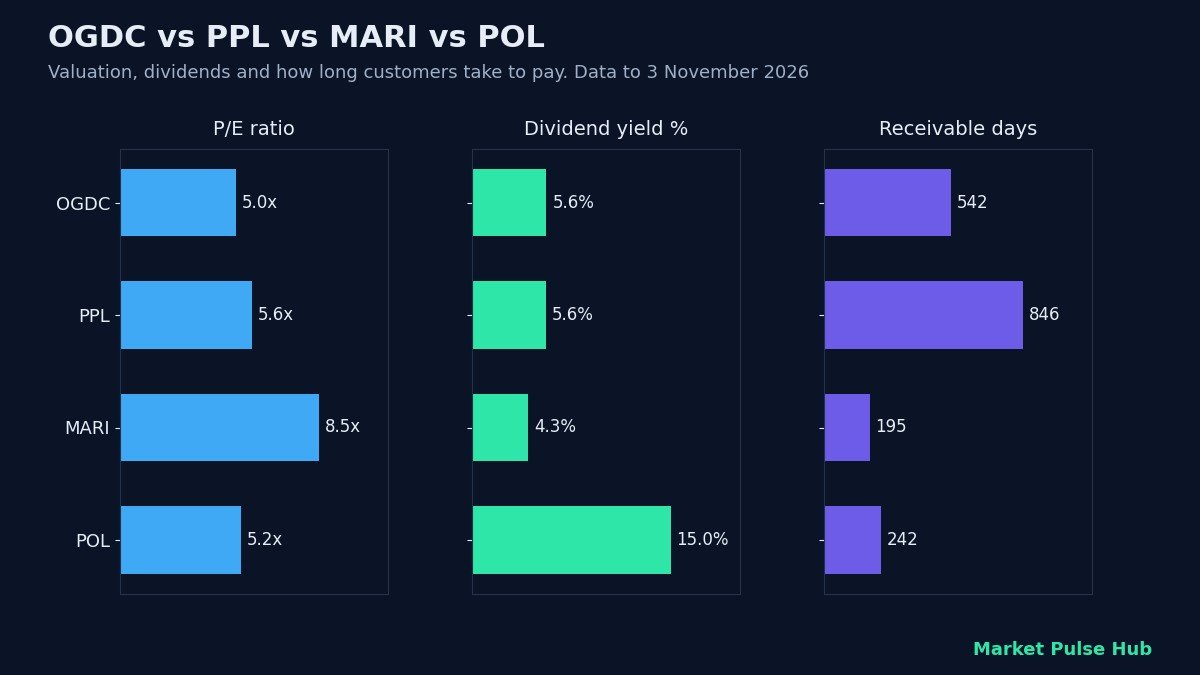
The four listed oil and gas explorers
The exchange’s oil and gas exploration sector has four members in our data, with a combined market value of about Rs 2,860 bn. OGDC is the largest at Rs 1,306 bn, and on 3 November 2026 it carried about 4.2% of the KSE-100’s weight, with MARI at 3.4% and PPL at 3.0%. All four have a June financial year, so the quarter to 30 September 2026 is the first quarter of FY27.
OGDC vs PPL: valuation and profitability
The table compares the main valuation and return measures. If you are new to these terms, see our explainers on the P/E ratio and EV/EBITDA.
| Stock | Company | Price (Rs) | Market cap | P/E | P/B | EV/EBITDA | Dividend yield | ROE | Net margin |
|---|---|---|---|---|---|---|---|---|---|
| OGDC | Oil and Gas Development Co. | 303.63 | Rs 1,306 bn | 5.0x | 0.8x | 3.3x | 5.6% | 16.6% | 54.1% |
| PPL | Pakistan Petroleum | 212.91 | Rs 579 bn | 5.6x | 0.7x | 3.0x | 5.6% | 12.8% | 36.3% |
| MARI | Mari Energies | 655.66 | Rs 787 bn | 8.5x | 2.4x | 6.7x | 4.3% | 28.1% | 45.7% |
| POL | Pakistan Oilfields | 662.45 | Rs 188 bn | 5.2x | 2.3x | – | 15.0% | 44.2% | 53.9% |
OGDC and PPL both trade at low multiples: P/E of 5.0 and 5.6, and below their book value (P/B under 1). OGDC earns a higher net margin, 54.1% against 36.3%, and a higher ROE, 16.6% against 12.8%. Both have almost no borrowings. PPL has the lowest EV/EBITDA of the group at 3.0, which means its operating earnings look cheap even after counting its cash.
MARI is valued more richly, at a P/E of 8.5 and nearly 2.4 times book value, alongside a faster growth record: five-year sales growth of 21% a year against 13% for OGDC and 12% for PPL. POL has the highest ROE, 44.2%, and by far the highest trailing dividend yield at 15.0%, because it pays out most of its profit.
Dividends
All four companies have paid a dividend in each of the last 20 years in our records. On trailing payments, POL yields 15.0%, OGDC 5.6%, PPL 5.6% and MARI 4.3%. OGDC and PPL pay out roughly a third of their profit (30% and 33% respectively in our data), which leaves room for higher payouts if cash collections improve. For how yield is worked out, see dividend yield explained.
The receivables problem
The biggest difference between these companies is not on the income statement. It is how long their customers take to pay. Receivable days measure how many days of sales are sitting unpaid on the balance sheet (see our guide to receivable days).
| Stock | Receivable days | Current ratio | Pulse Score (out of 100) | Fair value estimate (Rs) | Margin of safety | KMI-30 member |
|---|---|---|---|---|---|---|
| OGDC | 542 | 9.72x | 73.1 | 1,105 | 72.5% | Yes |
| PPL | 846 | 4.56x | 77.2 | 650 | 67.2% | Yes |
| MARI | 195 | 2.56x | 58.4 | 1,435 | 54.3% | Yes |
| POL | 242 | 1.91x | 73.0 | 2,327 | 71.5% | No |
PPL’s receivables equal about 846 days of sales and OGDC’s about 542 days, compared with 242 for POL and 195 for MARI. Much of this money is owed by state-linked gas and power companies, the chain of unpaid bills often called circular debt. Large receivables do not reduce reported profit, but they tie up cash that could otherwise be paid as dividends. Any settlement of these dues tends to matter a lot for OGDC and PPL shareholders.
Pulse Score and fair value
The Pulse Score is our score out of 100 that sums up a company’s growth, financial stability, valuation, working capital and cash flow from its reported results. Fair value is our estimate of what a share could be worth, blended from several models such as discounted cash flow and an earnings-based method, and margin of safety is how far the price sits below it. Both are estimates, not price targets. PPL scores 77.2, OGDC 73.1, POL 73.0 and MARI 58.4. All four lose points on working capital because of slow collections. Our checks also flag that OGDC’s profit grew much faster than its operating profit over the last year and that its tax ratio was very low, about 2%, so it is worth checking how much of its recent profit growth came from one-off or tax items.
All four show large margins of safety in our models. Fair value models for E&P companies are especially sensitive to oil and gas price assumptions and to whether receivables are eventually collected, so treat these numbers with care. Read more in our guide to intrinsic value and margin of safety.
Latest quarter: July to September 2026
Figures below come from each company’s quarterly report for the three months to 30 September 2026, compared with the same quarter a year earlier.
| Stock | Sales | Profit after tax | Same quarter last year | Profit change | EPS (Rs) |
|---|---|---|---|---|---|
| OGDC | Rs 132.4 bn | Rs 58.51 bn | Rs 38.30 bn | +52.8% | 13.60 |
| PPL | Rs 74.0 bn | Rs 25.20 bn | Rs 20.09 bn | +25.5% | 9.26 |
| MARI | Rs 64.1 bn | Rs 21.77 bn | Rs 15.64 bn | +39.2% | 18.13 |
| POL | Rs 16.8 bn | Rs 8.54 bn | Rs 5.89 bn | +45.1% | 30.10 |
All four grew profit strongly. OGDC’s profit rose 53% and POL’s 45%, MARI’s 39% and PPL’s 25%. Our PPL Q1 FY27 results report covers PPL’s quarter in more detail.
What drives E&P profits
- Oil prices and the rupee: wellhead prices for oil and much of the gas these companies sell are linked to international prices and paid in rupees, so a higher oil price or a weaker rupee lifts revenue.
- Production: new discoveries and field development add volumes, while natural decline in older fields reduces them.
- Collections: as shown above, the cash actually received can be very different from reported sales.
- Interest income: companies with large cash balances, such as OGDC and PPL, earn more when interest rates are high.
Frequently asked questions
OGDC vs PPL: which is bigger?
OGDC is the larger company, with a market value of about Rs 1,306 bn on 3 November 2026 against about Rs 579 bn for PPL.
Which oil and gas stock has the highest dividend yield on PSX?
Among the four explorers, POL had the highest trailing dividend yield at 15.0% on 3 November 2026. Past dividends do not guarantee future payments.
Why are receivable days so high for OGDC and PPL?
A large part of their gas sales goes to state-linked utilities that have been slow to pay, so unpaid bills build up on their balance sheets. This affects their cash flow and dividends more than their reported profit.
Are OGDC, PPL, MARI and POL Shariah-compliant?
OGDC, PPL and MARI were members of the KMI-30 Shariah index in our latest data; POL was not. Membership is reviewed twice a year, so check the latest list on our KMI-30 stocks list.
Which E&P stock has the highest Pulse Score?
PPL had the highest Pulse Score of the four at 77.2 out of 100 on 3 November 2026. The score is an estimate of business quality based on reported results, not a recommendation.
Use the free Market Pulse Hub dashboard to check any of these stocks yourself, and join the waitlist to get new tools and reports first.
Bilal, Market Pulse Hub
Figures are from company results, exchange data and our calculations up to 3 November 2026 and will change as new data arrives. This article is for education only and is not investment advice.