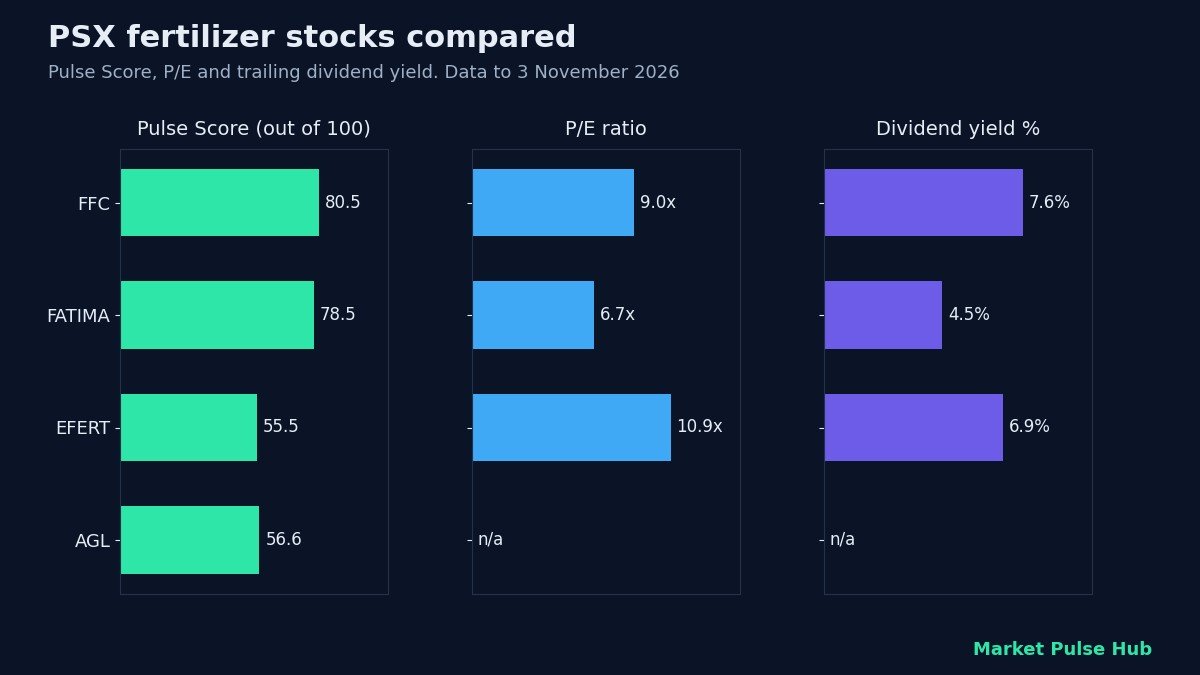
Fertilizer stocks PSX investors follow are some of the largest and most dividend-focused companies on the Pakistan Stock Exchange. This guide compares the listed urea and DAP makers, FFC, FATIMA, EFERT and AGL, on valuation, profitability, debt, dividends and their latest quarterly results, using exchange data and company reports up to 3 November 2026.
Why fertilizer stocks matter on the PSX
Pakistan is a farming economy, and urea and DAP are bought every crop season whatever the market mood. That steady demand has made the sector a favourite of income investors. In our data the four producers have a combined market value of about Rs 1,408 bn. FFC alone is worth Rs 824 bn, which made it the largest single weight in the KSE-100, at about 9.7% of the index on 3 November 2026.
The exchange also lists Arif Habib Corporation (AHCL) in the fertilizer sector. AHCL is an investment holding company, so its margins and results are not comparable with the producers and we leave it out of the tables below.
Fertilizer stocks PSX comparison table
The first table shows the basic valuation and quality measures for each company. P/E is the share price divided by the last twelve months of earnings per share (see our P/E ratio explainer). Dividend yield is the cash paid per share over the last year divided by the current price (see dividend yield explained). ROE is net profit divided by shareholders’ equity (see ROE explained).
| Stock | Company | Price (Rs) | Market cap | P/E | Dividend yield | ROE | Net margin | Debt / equity |
|---|---|---|---|---|---|---|---|---|
| FFC | Fauji Fertilizer | 572.37 | Rs 824 bn | 9.0x | 7.6% | 31.8% | 17.2% | 0.36x |
| FATIMA | Fatima Fertilizer | 138.17 | Rs 290 bn | 6.7x | 4.5% | 22.2% | 14.8% | 0.28x |
| EFERT | Engro Fertilizers | 201.70 | Rs 269 bn | 10.9x | 6.9% | 48.6% | 9.8% | 1.64x |
| AGL | Agritech | 41.54 | Rs 25 bn | – | – | -23.3% | -10.3% | 1.75x |
Prices are closing prices on 3 November 2026. Agritech has made losses over the last twelve months, so it has no meaningful P/E, and it has not paid a dividend in the last ten years in our records.
What the numbers say about each company
Fauji Fertilizer (FFC)
FFC is the sector leader by size and has the longest dividend record: payouts in each of the last 20 years in our data. It trades at a P/E of 9.0 with a trailing dividend yield of 7.6% and an ROE of 31.8%. Debt is moderate at 0.36 times equity. The Pulse Score flags one point to watch: sales have grown faster than profit over five years.
Fatima Fertilizer (FATIMA)
FATIMA has the lowest P/E of the group at 6.7 and the least debt, 0.28 times equity. Its dividend yield of 4.5% is lower than FFC’s, but its annual dividend has grown at about 31% a year over five years. Our checks flag high accruals, which means reported earnings were less well backed by cash than at FFC. Its quarterly profit fell, as the results table further down shows.
Engro Fertilizers (EFERT)
EFERT has the highest ROE in the group at 48.6%, but that partly reflects a thin equity base: debt is 1.64 times equity, the highest among the producers. It pays out most of its profit, so its yield of 6.9% is high, but five-year sales and profit growth have been close to flat. Of the four, it is the only one where our fair value estimate sits below the market price.
Agritech (AGL)
AGL is the smallest producer, with a market value of Rs 25 bn. It is loss-making over the last twelve months and carries debt of 1.75 times equity. Its share price is down 41% over the past year. It is a very different risk profile from the three larger names.
Pulse Score and fair value for fertilizer stocks
The Pulse Score is our score out of 100 that sums up a company’s growth, financial stability, valuation, working capital and cash flow, based on its reported results. A higher score means more of these checks look healthy; it is an estimate, not a forecast. Fair value is our estimate of what a share could be worth, blended from several valuation models such as discounted cash flow and an earnings-based method. Margin of safety is how far the price is below that estimate. You can read more in our guide to intrinsic value and margin of safety.
| Stock | Pulse Score (out of 100) | Fair value estimate (Rs) | Price (Rs) | Margin of safety | 1-year price change |
|---|---|---|---|---|---|
| FFC | 80.5 | 1,267 | 572.37 | 54.8% | 20.1% |
| FATIMA | 78.5 | 394 | 138.17 | 64.9% | 7.3% |
| EFERT | 55.5 | 134 | 201.70 | -51.0% | -0.9% |
| AGL | 56.6 | 70 | 41.54 | 40.7% | -40.6% |
Fair value models are sensitive to their inputs, especially growth and discount rates, so treat these figures as a rough guide to relative value rather than price targets. A negative margin of safety, as for EFERT, means the price is above our estimate. The 1-year price change runs from 30 October 2025 to 3 November 2026.
Latest quarterly results
All four producers have a December financial year, so the quarter to 30 September 2026 is their third quarter. Profit after tax below comes from each company’s quarterly report filed with the exchange; AGL’s figures are from its results announcement to the exchange. Group (consolidated) figures can differ.
| Stock | Profit, quarter to Sep 2026 | Same quarter 2025 | Change |
|---|---|---|---|
| FFC | Rs 28.60 bn | Rs 25.09 bn | +14.0% |
| FATIMA | Rs 9.52 bn | Rs 11.98 bn | -20.5% |
| EFERT | Rs 9.12 bn | Rs 5.81 bn | +57.0% |
| AGL | loss of Rs 2.03 bn | loss of Rs 0.04 bn | loss widened |
FFC and EFERT both grew profit in the quarter, while FATIMA’s profit fell even though its sales were higher; our Fatima Fertilizer results report explains the drop in other income behind it. AGL’s loss widened sharply as sales fell. For the details of FFC’s quarter, see our FFC nine-month results report.
What drives fertilizer company profits
- Gas prices and supply: natural gas is the main raw material for urea. Changes to the gas price set for fertilizer plants, or interruptions in supply, feed straight into margins.
- Urea and DAP prices: local prices depend on demand from farmers, government policy and, for DAP, international prices and the rupee.
- Crop seasons: sales peak around the Rabi (wheat) and Kharif (cotton and rice) sowing seasons, so single quarters can look uneven.
- Other income and investments: FFC and FATIMA hold investments and cash that add to profit. When interest rates or investment income change, profit can move even if fertilizer sales do not.
- Debt and interest rates: more indebted producers, such as EFERT and AGL, are more exposed to the SBP policy rate.
How to use this comparison
A low P/E or a high yield on its own does not make a stock attractive. Check whether the dividend is covered by cash flow, whether debt is rising and whether profit growth keeps up with sales. Each company has its own page with full ratios, dividends and results on the Market Pulse Hub dashboard, and you can compare fertilizer names with the rest of the market in our highest dividend yield stocks list.
Frequently asked questions
Which is the largest fertilizer company on the PSX?
By market value, Fauji Fertilizer (FFC) was the largest listed fertilizer company on 3 November 2026, worth about Rs 824 bn.
Which fertilizer stock has the highest dividend yield?
On trailing dividends, FFC had the highest yield among the producers at 7.6%, followed by EFERT at 6.9% and FATIMA at 4.5%. Past dividends do not guarantee future payments.
Are fertilizer stocks Shariah-compliant?
FFC and EFERT were members of the KMI-30 Shariah index in our latest data, while FATIMA and AGL were not. Index membership is reviewed twice a year, so check the latest list on our KMI-30 stocks list.
Why does EFERT have a high ROE but a low Pulse Score?
EFERT’s ROE is high partly because its equity is small relative to its debt. Its Pulse Score is held back by flat five-year growth, rising debt and earnings that were less well backed by cash.
Why is AHCL listed in the fertilizer sector?
Arif Habib Corporation is classified under fertilizer on the exchange, but it is an investment holding company, so its ratios are not comparable with the producers.
Use the free Market Pulse Hub dashboard to check any of these stocks yourself, and join the waitlist to get new tools and reports first.
Bilal, Market Pulse Hub
Figures are from company results, exchange data and our calculations up to 3 November 2026 and will change as new data arrives. This article is for education only and is not investment advice.