Looking for debt free companies on PSX? Companies that borrow little have fewer fixed interest bills to pay, more room to keep paying dividends when the economy slows, and less risk of being squeezed by a lender. Using company accounts and closing prices up to 2 November 2026, we screened every non-financial company on the Pakistan Stock Exchange with a market value of at least Rs 5 billion and found 19 whose total borrowings were below 2% of shareholders’ equity at their latest reported quarter.
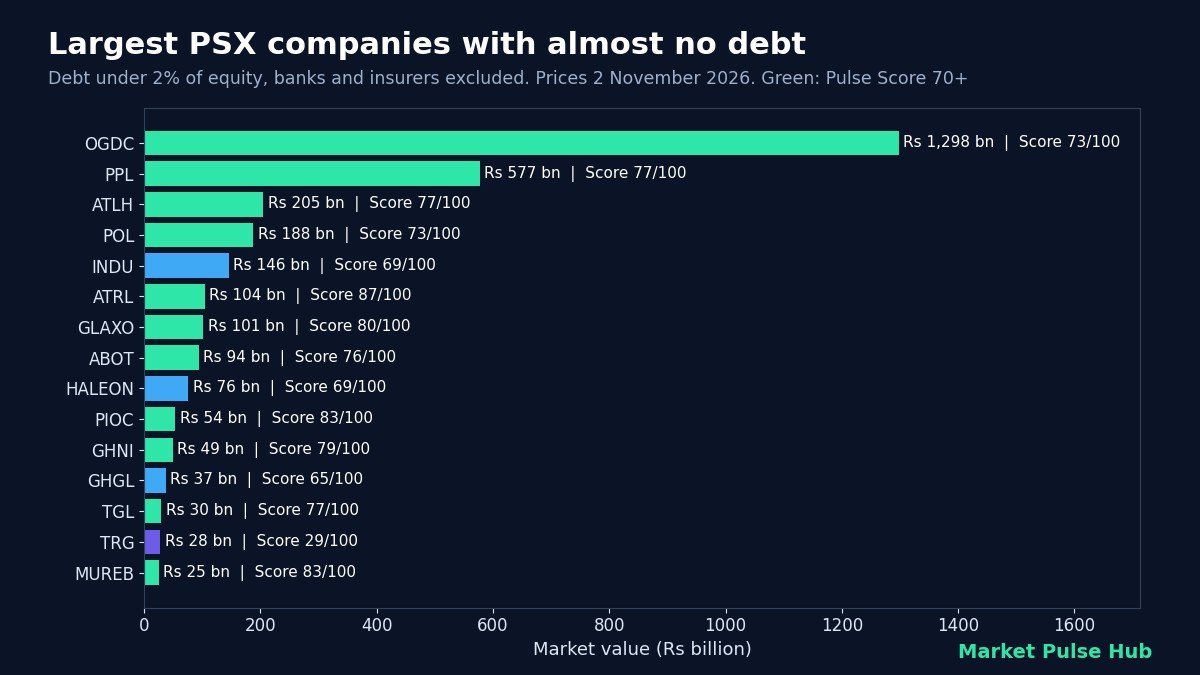
This list is a starting point for research, not a shopping list. A clean balance sheet tells you a company is unlikely to get into trouble with lenders. It does not tell you whether the business is growing, whether the share price is reasonable, or whether the cash on the books belongs to minority shareholders in practice. Below we explain how the screen works, show the full table, and look at what the numbers can and cannot tell you.
How we screened for debt free companies on PSX
We used the fundamentals and price data behind the Market Pulse Hub stock dashboard. The rules were simple:
- Total debt below 2% of equity at the latest quarter for which a debt figure was reported. Total debt is the borrowing figure from the company’s accounts as collected in our data. We used 2% rather than exactly zero because many sound companies carry a small lease liability or a running finance line.
- Positive shareholders’ equity. A company with negative equity can show a tiny debt-to-equity ratio for the wrong reason, so those were removed.
- Market value of at least Rs 5 billion, to keep the list to companies with a reasonable size and trading history.
- Banks, insurers, modarabas and leasing companies excluded. For a bank, deposits and borrowings are the raw material of the business, so “debt free” has no useful meaning there.
- A Pulse Score and fair value estimate had to be available, so every name in the table can be compared on the same basis.
If you are new to the ratio itself, our explainer on what the debt to equity ratio is walks through the calculation with PSX examples.
Two terms used in the table: Pulse Score and fair value
The Pulse Score is our estimate of business quality, out of 100. It combines five groups of checks taken from the company’s accounts: growth, stability (such as margins and liquidity), valuation, inventory and receivables discipline, and cash flow. A higher score means more of those checks came out well. It is a summary of past and current figures, not a forecast and not a rating to buy or sell.
Fair value is our estimate of what a share might be worth based on its earnings and cash flows, averaged across a few standard models such as discounted cash flow. The margin of safety is how far the current price sits below that estimate, in percent; a negative number means the price is above the estimate. Fair value models are sensitive to their inputs, and a very large gap often means the model is missing something (a one-off profit, a cyclical peak, or cash that cannot be paid out). Our guide to intrinsic value and margin of safety explains the limits in detail.
The full list: 19 PSX companies with almost no debt
Market value and prices are as of the close on 2 November 2026. Debt is the total borrowing figure from the latest quarter shown in the “Debt as of” column. P/E and dividend yield are trailing figures; a dash means the figure is not available or not meaningful.
| Symbol | Company | Sector | Market value (Rs bn) | Debt (Rs m) | Debt as of | Debt / equity | Pulse Score /100 | Price (Rs) | Fair value est. (Rs) | P/E | Div. yield |
|---|---|---|---|---|---|---|---|---|---|---|---|
| OGDC | Oil & Gas Development Co. Ltd. | Oil & Gas Exploration Companies | 1,297.5 | 1,726.4 | Sep 2026 | 0.11% | 73 | 301.68 | 1,105 | 4.9 | 6.0% |
| PPL | Pakistan Petroleum Limited | Oil & Gas Exploration Companies | 577.0 | 2,440.0 | Sep 2026 | 0.30% | 77 | 212.06 | 650 | 5.6 | 5.6% |
| ATLH | Atlas Honda Limited | Automobile Assembler | 205.1 | 571.1 | Sep 2026 | 1.12% | 77 | 1,652.76 | 3,341 | 8.9 | 6.8% |
| POL | Pakistan Oilfields Limited | Oil & Gas Exploration Companies | 187.5 | 0.0 | Jun 2026 | 0.00% | 73 | 660.72 | 2,327 | 5.1 | 15.0% |
| INDU | Indus Motor Co. Ltd. | Automobile Assembler | 145.5 | 149.9 | Sep 2026 | 0.17% | 69 | 1,851.32 | 6,361 | 5.6 | 10.8% |
| ATRL | Attock Refinery Ltd | Refinery | 104.5 | 0.0 | Sep 2026 | 0.00% | 87 | 979.95 | 5,764 | 2.4 | 1.6% |
| GLAXO | GlaxoSmithKline Pakistan Limited | Pharmaceuticals | 101.3 | 338.0 | Sep 2026 | 0.97% | 80 | 317.97 | 574 | 9.2 | 5.9% |
| ABOT | Abbott Laboratories Pakistan Limited | Pharmaceuticals | 93.8 | 400.8 | Sep 2026 | 1.15% | 76 | 958.42 | 1,383 | 10.1 | 4.1% |
| HALEON | Haleon Pakistan Limited | Pharmaceuticals | 76.2 | 248.3 | Sep 2026 | 1.50% | 69 | 650.73 | 898 | 11.7 | 4.6% |
| PIOC | Pioneer Cement Limited | Cement | 53.5 | 0.0 | Sep 2026 | 0.00% | 83 | 235.63 | 754 | 7.1 | – |
| GHNI | Ghandhara Industries Limited | Automobile Assembler | 49.5 | 0.0 | Sep 2026 | 0.00% | 79 | 1,160.61 | 3,273 | 6.2 | 1.0% |
| GHGL | Ghani Glass Limited | Glass & Ceramics | 37.3 | 40.0 | Sep 2026 | 0.09% | 65 | 37.32 | 137 | 4.9 | 10.8% |
| TGL | Tariq Glass Industries Limited | Glass & Ceramics | 29.6 | 238.3 | Sep 2026 | 0.84% | 77 | 171.65 | 552 | 6.4 | 2.9% |
| TRG | TRG Pakistan Limited | Technology & Communication | 28.3 | 0.0 | Mar 2026 | 0.00% | 29 | 51.87 | 47 | – | – |
| MUREB | Murree Brewery Co., Ltd. | Food & Personal Care Products | 25.0 | 5.4 | Sep 2026 | 0.02% | 83 | 902.48 | 2,632 | 6.2 | 4.8% |
| AGTL | Al-Ghazi Tractors Ltd. | Automobile Assembler | 20.3 | 23.4 | Sep 2026 | 0.19% | 74 | 349.94 | 1,052 | 6.3 | – |
| PKGP | Pakgen Power Limited | Power Generation & Distribution | 9.7 | 0.0 | Jun 2026 | 0.00% | 40 | 26.02 | 352 | – | – |
| KSBP | KSB Pumps Company Limited | Engineering | 6.2 | 0.0 | Sep 2026 | 0.00% | 50 | 200.06 | 121 | 25.6 | 0.5% |
| PECO | Pakistan Engineering Co. Ltd. | Engineering | 5.2 | 95.9 | Jun 2026 | 0.26% | 31 | 919.02 | 5,177 | – | – |
What stands out in the list
Oil and gas explorers dominate by size
Oil & Gas Development Co. Ltd. (OGDC) is the largest company in the screen at about Rs 1,297.5 billion, and the three exploration and production companies together (OGDC, PPL, POL) make up a large share of the total market value. Explorers largely fund drilling from operating cash flow rather than loans, which keeps their borrowings low. Their weak spot is different: receivables from the gas chain can build up for long periods, so low debt does not always mean high cash.
Vehicle makers and pharmaceutical companies
4 automobile assemblers (ATLH, INDU, GHNI, AGTL) pass the screen. Assemblers often collect advance payments from customers, so they can run with little or no borrowing even while sales are growing. The 3 pharmaceutical companies (GLAXO, ABOT, HALEON) are the local arms of multinational groups.
Zero reported borrowing
7 companies reported no borrowing at all at their latest quarter: POL, ATRL, PIOC, GHNI, TRG, PKGP, KSBP. Some of these, such as holding companies, have little need to borrow at the parent level, so it is worth reading the consolidated accounts too.
Quality scores vary widely
12 of the 19 companies have a Pulse Score of 70 or more out of 100, while others sit well below 50. A low score with no debt usually means the problem is elsewhere: weak growth, thin cash flow or slow collections. For example, TRG (29), PECO (31) and PKGP (40) have the lowest scores in the group. 4 of the companies (OGDC, PPL, ATRL, GHNI) are also members of the KMI-30 Shariah index; see our KMI-30 stocks list for the full index.
Why low debt matters for Pakistani investors
Pakistan has gone through long stretches of high interest rates. When the policy rate is high, a company with large loans hands a big part of its operating profit to banks, and the shareholders get what is left. A company with no borrowings keeps the whole operating profit, apart from tax. Low debt also means the company does not need to refinance when credit is tight, and it has room to borrow later if a good opportunity comes along.
There is a trade-off. A company with no debt and a lot of idle cash can earn a lower return on equity than a well-run company that uses some borrowing to grow. That is why a debt free screen works best next to profitability checks such as return on equity and cash flow, not on its own. Our list of the most profitable PSX companies by ROE and net margin is a natural companion.
Limits of this screen
- Timing. Debt is taken from the latest reported quarter, which is the quarter to September 2026 for most companies but earlier for a few (see the “Debt as of” column). Balances can change quickly.
- Other obligations. Trade payables, customer advances, deferred liabilities and guarantees are not counted as debt here, but they still have to be paid.
- Fair values are estimates. Large gaps between price and fair value deserve extra checking before you rely on them.
To run your own version, for example with a higher market value cut-off or a minimum dividend yield, use the filters described in our PSX stock screener guide.
Frequently asked questions
Which PSX companies have no debt?
In our screen of non-financial companies worth at least Rs 5 billion, 19 had total borrowings below 2% of equity at their latest quarter, and 7 of them (POL, ATRL, PIOC, GHNI, TRG, PKGP, KSBP) reported no borrowing at all. The list changes every quarter as new accounts are published.
Is a debt free company always a safe investment?
No. Low debt reduces one risk, the risk of not being able to repay lenders, but the share price can still fall if profits drop, if the stock was expensive to begin with, or if the company holds cash it cannot use. Look at profitability, cash flow and valuation as well.
Why are banks not included?
Banks borrow by design: customer deposits are a liability on their balance sheet and are the raw material of the business. Measuring them by debt to equity would make every bank look highly indebted, so we leave banks, insurers, modarabas and leasing companies out.
What debt to equity ratio is considered low?
There is no single rule, and it depends on the industry. As a rough guide, a ratio under 0.5 is usually seen as conservative for an industrial company. Our screen is much stricter, at under 0.02, so it picks out companies with almost no borrowing at all.
How often is this list updated?
The underlying data on Market Pulse Hub is refreshed as companies publish results and as prices change each trading day. Figures in this article are as of 2 November 2026, so check the individual stock pages for the latest numbers.
Want to track debt, scores and fair values as companies report? Join the Market Pulse Hub waitlist to get early access.
Bilal, Market Pulse Hub
Figures are from company results, exchange data and our calculations up to 2 November 2026 and will change as new data arrives. This article is for education only and is not investment advice.