Auto stocks PSX investors follow are the companies that assemble cars, motorcycles, trucks and tractors in Pakistan, plus the parts makers that supply them. This guide compares the 8 listed automobile assemblers on valuation, margins, dividends and their latest quarterly results, using exchange data and company filings up to 6 November 2026. Together they had a market value of about Rs 686.8 bn, and 7 of them are in the KSE-100 index.
What drives auto stocks in Pakistan
Car and bike makers sell big-ticket items, many of them bought on credit, so their sales rise and fall with interest rates, the rupee, import rules and consumer confidence. Most assemblers import a large share of their parts and kits, which means a weaker rupee raises costs, while lower interest rates make car financing cheaper and usually lift demand. Tractor makers depend more on farm incomes and crop prices.
Because of this, auto profits can swing sharply from one year to the next. That is worth remembering when you look at a low P/E: it may reflect a strong year that will not repeat. Our guide to how SBP interest rate changes move stocks explains the rate link in more detail.
Auto stocks PSX comparison: valuation, margins and dividends
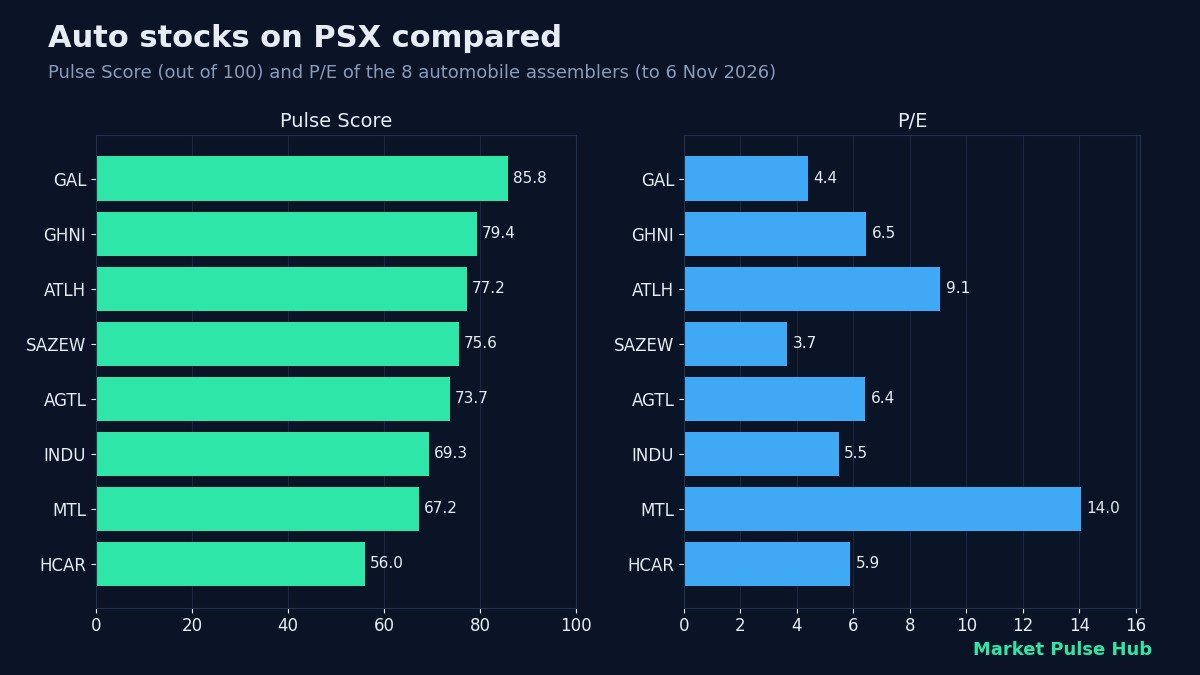
The Pulse Score is our estimate of a company’s financial quality and value, scored out of 100 from about 30 checks on growth, stability, valuation, working capital and cash flow taken from its published accounts. Fair value is our estimate of what a share is worth, averaged from several methods based on earnings and cash flow; both are estimates, not price targets. The table ranks the assemblers by market value. Dividend yield is the trailing yield from our dividend records.
| Symbol | Company | Price (Rs) | Market value (Rs bn) | P/E | Operating margin | Net margin | ROE | Dividend yield | Pulse Score (out of 100) | Fair value estimate (Rs) | Red flags |
|---|---|---|---|---|---|---|---|---|---|---|---|
| ATLH | Atlas Honda Limited | 1,685.68 | 209.2 | 9.1 | 10.2% | 7.4% | 45.1% | 6.5% | 77.2 | 3,341 | 0 |
| INDU | Indus Motor Co. Ltd. | 1,822.36 | 143.2 | 5.5 | 10.5% | 9.7% | 28.9% | 10.9% | 69.3 | 6,361 | 2 |
| MTL | Millat Tractors Limited | 292.30 | 116.6 | 14.0 | 26.1% | 12.3% | 70.4% | 7.5% | 67.2 | 308 | 1 |
| SAZEW | Sazgar Engineering Works Limited | 1,408.10 | 85.1 | 3.7 | 19.3% | 11.6% | 50.7% | 4.3% | 75.6 | 6,584 | 1 |
| GHNI | Ghandhara Industries Limited | 1,203.68 | 51.3 | 6.5 | 18.3% | 11.7% | 31.8% | 1.1% | 79.4 | 3,273 | 1 |
| GAL | Ghandhara Automobiles Limited | 558.47 | 31.8 | 4.4 | 19.7% | 14.8% | 30.9% | 2.3% | 85.8 | 1,604 | 3 |
| HCAR | Honda Atlas Cars (Pakistan) Ltd. | 201.61 | 28.8 | 5.9 | 4.3% | 3.7% | 18.4% | 4.5% | 56.0 | 411 | 4 |
| AGTL | Al-Ghazi Tractors Ltd. | 357.22 | 20.7 | 6.4 | 19.0% | 11.5% | 26.5% | n/a | 73.7 | 1,052 | 3 |
P/E ranges from 3.7 for SAZEW to 14.0 for MTL. Net margins are thin for car assemblers such as Honda Atlas Cars (HCAR) at 3.7%, and higher for Ghandhara Industries (GHNI) and Sazgar (SAZEW). The highest Pulse Score in the group belongs to GAL at 85.8, though it also carries 3 red flags, a reminder to read the score together with the warnings. “Red flags” counts warnings from our accounting checks, such as profit not backed by operating cash flow; you can read each one on the stock page.
If you are new to these measures, our explainers on the P/E ratio and return on equity are a good place to start.
Latest quarterly results
The next table shows sales and profit after tax for each assembler’s latest reported quarter against the same quarter a year earlier. Companies have different financial years: Honda Atlas Cars and Atlas Honda close their year in March, so their quarters do not line up with the others.
| Symbol | Quarter to | Sales (Rs bn) | Sales change | Profit after tax (Rs bn) | Profit change |
|---|---|---|---|---|---|
| ATLH | September 2026 | 80.2 | +27% | 5.5 | +15% |
| INDU | September 2026 | 74.0 | +20% | 7.4 | +10% |
| MTL | September 2026 | 11.1 | +43% | 0.9 | +57% |
| SAZEW | September 2026 | 41.7 | +23% | 4.0 | -9% |
| GHNI | September 2026 | 18.9 | +58% | 2.6 | +65% |
| GAL | September 2026 | 15.7 | +16% | 2.5 | +51% |
| HCAR | June 2026 | 37.2 | +41% | 2.5 | +200% |
| AGTL | September 2026 | 3.6 | +76% | 0.2 | from a loss |
Most assemblers reported higher sales than a year earlier. Indus Motor (INDU), the maker of Toyota cars in Pakistan, earned Rs 7.4 bn in the quarter to September 2026, up 10% from a year before. Atlas Honda (ATLH) earned Rs 5.5 bn on sales of Rs 80.2 bn. Sazgar was the exception among the larger names, with sales up but profit down 9%. Where a company reports both group and company-only figures, totals can differ from other sources, so check the filing before relying on one number.
Tractors and bikes behave differently from cars
Millat Tractors (MTL) and Al-Ghazi Tractors (AGTL) sell mainly to farmers, so their demand follows crop incomes more than car loans. Millat stands out for a return on equity of 70.4% and a dividend yield of 7.5%, but it also carries more debt than the others, with debt to equity of 1.3 times, which our checks flag. Atlas Honda, the Honda motorcycle maker, has paid a dividend every year for 20 years in our records. Read more about Millat’s plans in our Millat Tractors electric bikes article.
Auto parts makers
The PSX automobile parts and accessories sector has 9 companies in our data. They supply batteries, tyres, wheels, wiring and other components, and their fortunes are tied to the assemblers’ production volumes.
| Symbol | Company | Market value (Rs bn) | P/E | Net margin | Pulse Score (out of 100) |
|---|---|---|---|---|---|
| THALL | Thal Limited | 42.1 | 3.7 | 24.6% | 73.2 |
| TBL | Treet Battery Ltd. | 9.9 | n/a | -0.6% | 35.3 |
| PTL | Panther Tyres Limited | 7.8 | 5.9 | 3.5% | 62.3 |
| ATBA | Atlas Battery Limited | 5.6 | n/a | -2.2% | 33.2 |
| AGIL | Agriauto Industries Limited | 4.8 | 3.7 | 6.9% | 79.0 |
| LOADS | Loads Ltd. | 4.4 | 9.6 | 5.7% | 60.7 |
| EXIDE | Exide Pakistan Ltd. | 3.2 | 9.6 | 1.9% | 30.6 |
| BWHL | Baluchistan Wheels Limited | 2.9 | 9.3 | 10.3% | 64.2 |
| GTYR | Ghandhara Tyre and Rubber Co Limited | 2.9 | n/a | -8.1% | 34.8 |
Thal (THALL) is the largest parts maker by market value. P/E shows n/a where the latest twelve months were loss-making.
How to use this comparison
A low P/E and a fair value estimate far above the price can look attractive, but in a cyclical sector they often mean the market expects profits to fall. Compare several years of results, look at how much cash the business generates, and check the red flags before drawing conclusions. You can filter all PSX stocks by sector, score and valuation on the Market Pulse Hub dashboard, and our KSE-100 companies list shows where the auto names sit in the index.
Frequently asked questions
Which auto stocks are listed on PSX?
There are 8 automobile assemblers in our data: Atlas Honda Limited (ATLH), Indus Motor Co. Ltd. (INDU), Millat Tractors Limited (MTL), Sazgar Engineering Works Limited (SAZEW), Ghandhara Industries Limited (GHNI), Ghandhara Automobiles Limited (GAL), Honda Atlas Cars (Pakistan) Ltd. (HCAR), Al-Ghazi Tractors Ltd. (AGTL), plus 9 parts and accessories makers.
Which PSX auto stock has the highest Pulse Score?
As of 6 November 2026, Ghandhara Automobiles Limited (GAL) had the highest Pulse Score among assemblers at 85.8 out of 100. The score is an estimate of financial quality and value, not a recommendation.
Why are auto stocks so sensitive to interest rates?
Many cars and bikes are bought on credit, so higher rates raise monthly payments and reduce demand. Lower rates usually help sales. Assemblers also import parts, so the rupee exchange rate affects their costs.
Do auto companies pay dividends?
Several do. Indus Motor and Atlas Honda have each paid a dividend every year for 20 years in our records, with trailing yields of 10.9% and 6.5%. Dividends depend on profit and can be cut in weak years.
Is a low P/E auto stock cheap?
Not necessarily. Auto profits swing with the economic cycle, so a low P/E after a strong year may rise sharply if profit falls. Look at several years of results and the cash flow before judging value.
Want alerts when scores, fair values and results change? Join the Market Pulse Hub waitlist.
Bilal, Market Pulse Hub
Figures are from company results, exchange data and our calculations up to 6 November 2026 and will change as new data arrives. This article is for education only and is not investment advice.