Technology stocks PSX investors follow include software exporters, a mobile phone maker, a technology holding company and the country’s main fixed-line telecom operator. This guide compares the sector’s largest names, including SYS, TRG, NETSOL and AIRLINK, on valuation, profitability, debt, Pulse Score and their latest results, using exchange data and company reports up to 4 November 2026.
The technology and communication sector on the PSX
The exchange groups software, telecom, IT services, media and electronics companies into one sector, “technology and communication”. Our data covers 15 of them, with a combined market value of about Rs 488 bn. Four are in the KSE-100: PTC, SYS, AIRLINK and TRG. Together they made up about 3.5% of the index on 4 November 2026, and SYS alone about 2.3%.
Because the sector mixes very different businesses, comparing them on one ratio can mislead. A telecom network, a software exporter and a holding company make money in different ways, so this guide looks at each group separately.
It has also been a hard year for prices. The median stock in the sector is down about 28% over the past year, while the KSE-100 rose about 6.4%. PTCL was the only one of the eight largest names to rise, up 24.2%.
Technology stocks PSX comparison table
P/E is the share price divided by the last twelve months of earnings per share (see our P/E ratio explainer). ROE is net profit divided by shareholders’ equity (see ROE explained). Dividend yield is cash dividends declared over the last twelve months divided by the current price.
| Stock | Company | Price (Rs) | Market cap | P/E | Dividend yield | ROE | Debt / equity | KSE-100 |
|---|---|---|---|---|---|---|---|---|
| PTC | PTCL | 46.19 | Rs 174.3 bn | 38.6x | – | 15.0% | 9.88x | Yes |
| SYS | Systems | 110.96 | Rs 169.9 bn | 14.0x | 1.8% | 18.8% | 0.19x | Yes |
| AIRLINK | Air Link Communication | 112.90 | Rs 44.6 bn | 7.9x | – | 22.7% | 1.92x | Yes |
| TRG | TRG Pakistan | 53.17 | Rs 29.0 bn | – | – | n/m | 0.00x | Yes |
| NETSOL | NetSol Technologies | 116.91 | Rs 10.5 bn | 3.9x | 1.3% | 19.1% | 0.17x | No |
| AVN | Avanceon | 24.11 | Rs 10.4 bn | – | 4.1% | -2.0% | 0.35x | No |
| HUMNL | Hum Network | 8.65 | Rs 9.8 bn | – | 11.6% | -0.1% | 0.02x | No |
| ZAL | Zarea | 33.03 | Rs 8.7 bn | 6.1x | 3.0% | 35.6% | 0.01x | No |
Prices are closing prices on 4 November 2026; the table shows the eight largest companies by market value. A dash means the figure is not meaningful, for example a P/E for a company with losses. TRG’s ROE is shown as n/m because it is a holding company whose profit comes mainly from changes in the value of its investment. The smaller listed members in our data are TPLT, TPL, WTL, OCTOPUS, QTECH, TELE and MDTL.
Systems (SYS): the sector’s largest software exporter
Systems is the biggest IT services company on the exchange, worth Rs 169.9 bn. Its sales have grown about 52% a year over five years, the fastest of the large names, and it has an ROE of 18.8% with little debt (0.19 times equity). It has paid a dividend in each of the last 12 years in our data, but the yield is low at 1.8% because most profit is reinvested. At Rs 110.96 its P/E is 14.0 and the shares are down 28.1% over the year. Our checks flag a very low tax ratio of about 6%, which means profit may partly rest on tax benefits that could change, and note that profit growth has lagged sales growth over five years. SYS is in the KMI-30. For more on how AI is changing its business, see our analysis of AI and PSX tech stocks.
NetSol (NETSOL) and Air Link (AIRLINK)
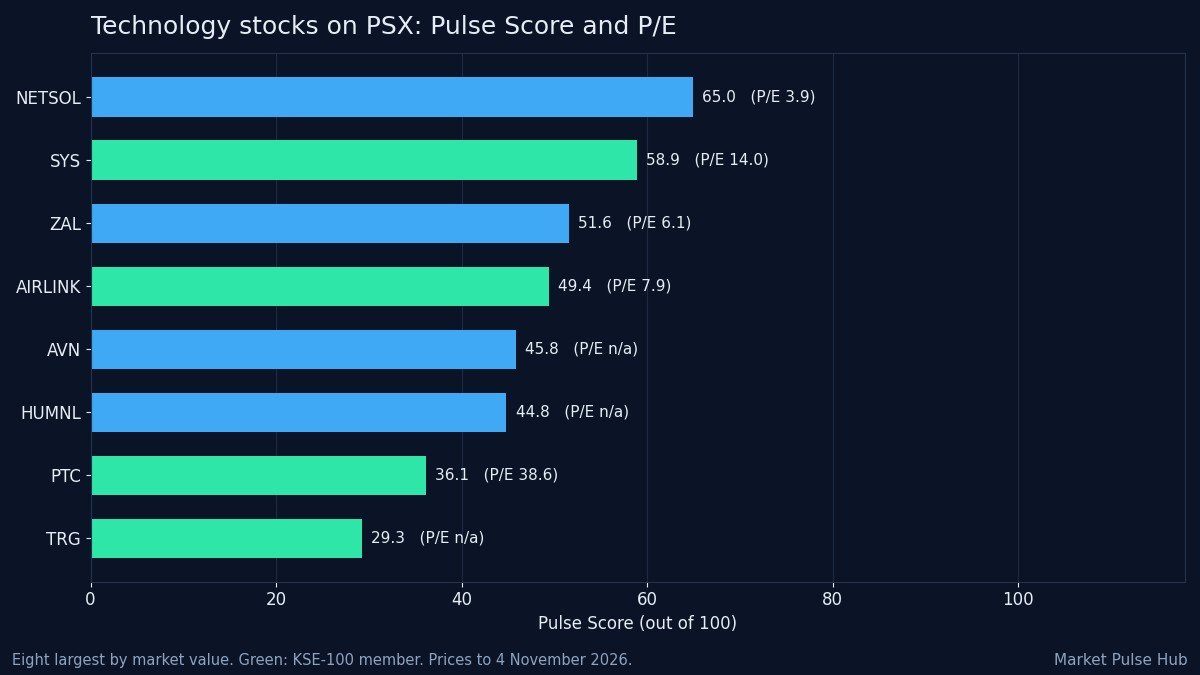
NetSol, which sells leasing and finance software to companies around the world, has the highest Pulse Score in the sector at 65.0 and the lowest P/E of the eight at 3.9, with an ROE of 19.1%. Those figures need care. Our checks flag that profit rose 97% while operating profit rose 55%, which points to other income, tax or one-off items, and that its tax ratio was close to zero. NetSol is not in the KSE-100, has a market value of only Rs 10.5 bn, and its results for the quarter to September 2026 were not yet in our data.
Air Link assembles and distributes mobile phones, so it is more of a consumer electronics business than a software company. It trades on a P/E of 7.9 with an ROE of 22.7%, but it carries the most debt of the group outside PTCL, at 1.92 times equity. Our checks flag negative operating cash flow last year and high accruals, meaning reported profit was not well backed by cash. Its share price is down 36.5% over the year. AIRLINK is in the KMI-30.
TRG Pakistan (TRG) and PTCL (PTC)
TRG is a holding company. Its main asset is its stake in TRG International (TRGIL), so its reported profit moves with the value of that stake rather than with sales. It trades at 0.89 times book value. Our TRG Q1 FY27 results report explains the latest numbers.
PTCL is the largest company in the sector by market value at Rs 174.3 bn. It is a capital-heavy telecom business with debt of 9.88 times equity in our data, a thin net margin of 1.7% and a P/E of 38.6. Its Pulse Score of 36.1 is held back by that debt, slow collections and weak profit growth.
Pulse Score and fair value for tech stocks
The Pulse Score is our score out of 100 that sums up a company’s growth, financial stability, valuation, working capital and cash flow, based on its reported results. A higher score means more of these checks look healthy; it is an estimate, not a forecast. Fair value is our estimate of what a share could be worth, blended from several valuation models such as discounted cash flow and an earnings-based method. Margin of safety is how far the price is below that estimate (see our guide to intrinsic value and margin of safety).
| Stock | Pulse Score (out of 100) | Fair value estimate (Rs) | Price (Rs) | Margin of safety | 1-year price change |
|---|---|---|---|---|---|
| NETSOL | 65.0 | 561 | 116.91 | 79.2% | -12.0% |
| SYS | 58.9 | 157 | 110.96 | 29.5% | -28.1% |
| ZAL | 51.6 | 86 | 33.03 | 61.7% | -35.5% |
| AIRLINK | 49.4 | 347 | 112.90 | 67.5% | -36.5% |
| AVN | 45.8 | 25 | 24.11 | 2.5% | -45.9% |
| HUMNL | 44.8 | 11 | 8.65 | 21.5% | -40.5% |
| PTC | 36.1 | 34 | 46.19 | -37.7% | 24.2% |
| TRG | 29.3 | 43 | 53.17 | -23.6% | -27.6% |
A negative margin of safety means the price is above our fair value estimate. Large margins of safety, such as NetSol’s and Air Link’s, often reflect the quality concerns described above; fair value models rely on reported earnings and cash flow and can be thrown off by one-off items. The 1-year price change runs from 31 October 2025 to 4 November 2026.
Latest quarterly results
The table below shows profit after tax for the quarter to 30 September 2026, against the same quarter of 2025. For Systems, the company’s results filing and the exchange’s results summary in our data give different figures. The filing shows larger figures that appear to be for the whole group; the smaller figures in the summary appear to be for the parent company alone, so check the filing for details.
| Stock | Source | Profit, quarter to 30 Sep 2026 | Same quarter 2025 | Change |
|---|---|---|---|---|
| SYS | Company results filing | Rs 3.03 bn | Rs 2.79 bn | +8.7% |
| SYS | Exchange results summary | Rs 1.53 bn | Rs 2.00 bn | -23.3% |
| TRG | Exchange results summary | Rs 2.75 bn | Rs 6.87 bn | -59.9% |
| ZAL | Exchange results summary | Rs 551 M | Rs 558 M | -1.2% |
For Air Link, PTCL, Avanceon and Hum Network, the figures in the company filings and the exchange’s results summary in our data do not match, so we have left them out until they are checked. NetSol’s quarterly figures were not yet in our data on 4 November 2026.
What drives tech company profits
- The rupee: software exporters such as Systems and NetSol earn mostly in foreign currency, so a weaker rupee lifts their rupee profits, while importers such as Air Link face higher costs.
- Tax treatment: low tax ratios at SYS and NETSOL show how much tax treatment matters to reported profit.
- Client spending abroad: demand from banks, telecom firms and governments in the Middle East, Europe and North America drives orders.
- Interest rates: indebted businesses such as PTCL and Air Link benefit when the SBP policy rate falls.
How to use this comparison
Look at each company for what it is: a services exporter, a product company, a phone maker, a telecom network or a holding company. Check whether profit is backed by cash and whether tax or one-off items explain a low P/E. Full ratios, dividends and results for each company are on the Market Pulse Hub dashboard, and our KSE-100 companies list shows how these names compare with the rest of the index.
Frequently asked questions
Which is the largest technology stock on the PSX?
By market value, PTCL (PTC) was the largest company in the technology and communication sector on 4 November 2026 at about Rs 174.3 bn, just ahead of Systems (SYS) at about Rs 169.9 bn. Among software companies, Systems is the largest.
Which tech stocks are in the KSE-100?
Four: PTC, SYS, AIRLINK and TRG. Together they made up about 3.5% of the index on 4 November 2026.
Are PSX tech stocks Shariah-compliant?
Systems (SYS) and Air Link (AIRLINK) were in the KMI-30 index in our latest data. Check the current KMI-30 stocks list, as membership is reviewed regularly.
Why is NetSol’s P/E so low?
NetSol’s P/E of 3.9 reflects a large jump in profit that was faster than its operating profit, and a near-zero tax ratio. If those items do not repeat, earnings could be lower, which is why a low P/E alone is not enough to judge a stock.
Do tech stocks on the PSX pay dividends?
Some do, but yields are mostly low. Systems has paid a dividend in each of the last 12 years in our data, with a trailing yield of about 1.8%. Past dividends do not guarantee future payments.
Use the free Market Pulse Hub dashboard to check these numbers yourself, and join the waitlist to get new tools and reports first.
Bilal, Market Pulse Hub
Figures are from company results, exchange data and our calculations up to 4 November 2026 and will change as new data arrives. This article is for education only and is not investment advice.