Pharma stocks PSX investors can buy range from large multinational subsidiaries to fast-growing local manufacturers. This guide compares all 12 listed pharmaceutical companies in our data, including SEARL, ABOT, GLAXO and HALEON, on valuation, profitability, dividends, debt and their latest quarterly results, using exchange data and company reports up to 4 November 2026.
The pharmaceutical sector on the PSX
The 12 companies in the exchange’s pharmaceutical sector have a combined market value of about Rs 511 bn in our data. Seven of them are in the KSE-100 index: ABOT, AGP, CPHL, GLAXO, HALEON, HINOON and SEARL. Together they made up about 2.4% of the index on 4 November 2026, so the sector is small next to banks or energy, but it contains some of the most profitable businesses on the exchange.
It has been a weak year for share prices. Every one of the 12 stocks is lower than a year ago, with a median fall of about 16.5%, while the KSE-100 rose about 6.4% over the same period. That gap is worth understanding before looking at valuations.
Pharma stocks PSX comparison table
P/E is the share price divided by the last twelve months of earnings per share (see our P/E ratio explainer). Dividend yield is cash dividends declared over the last twelve months divided by the current price (see dividend yield explained). ROE is net profit divided by shareholders’ equity (see ROE explained).
| Stock | Company | Price (Rs) | Market cap | P/E | Dividend yield | ROE | Net margin | Debt / equity | KSE-100 |
|---|---|---|---|---|---|---|---|---|---|
| GLAXO | GSK Pakistan | 329.51 | Rs 104.9 bn | 9.6x | 5.8% | 31.5% | 15.8% | 0.01x | Yes |
| ABOT | Abbott Pakistan | 969.50 | Rs 94.9 bn | 10.2x | 4.1% | 26.7% | 11.9% | 0.01x | Yes |
| HALEON | Haleon Pakistan | 669.26 | Rs 78.3 bn | 12.0x | 4.5% | 39.3% | 16.1% | 0.01x | Yes |
| HINOON | Highnoon Laboratories | 957.55 | Rs 50.7 bn | 12.2x | 5.2% | 30.1% | 14.4% | 0.08x | Yes |
| SEARL | Searle | 76.66 | Rs 45.1 bn | 65.8x | 1.3% | 1.9% | 1.8% | 0.26x | Yes |
| AGP | AGP | 151.58 | Rs 42.4 bn | 12.0x | 5.3% | 20.6% | 13.4% | 0.85x | Yes |
| HPL | Hoechst Pakistan | 3,965.01 | Rs 38.2 bn | 10.9x | 6.8% | 41.6% | 11.3% | 0.06x | No |
| FEROZ | Ferozsons | 355.09 | Rs 15.4 bn | 14.8x | 1.5% | 6.5% | 4.2% | 0.29x | No |
| CPHL | Citi Pharma | 62.46 | Rs 14.3 bn | 18.1x | – | 7.3% | 5.6% | 0.29x | Yes |
| BFBIO | BF Biosciences | 132.92 | Rs 11.7 bn | 17.9x | – | 12.0% | 6.7% | 0.30x | No |
| MACTER | Macter International | 227.91 | Rs 10.4 bn | 16.6x | – | 14.6% | 5.0% | 0.34x | No |
| IBLHL | IBL Healthcare | 41.48 | Rs 4.1 bn | 19.0x | – | 8.2% | 4.7% | 0.01x | No |
Prices are closing prices on 4 November 2026. Companies are sorted by market value. Ratios use the latest reported financials in our data. Other listed companies in the sector, including HPL, FEROZ, BFBIO, MACTER and IBLHL, are not in the KSE-100.
The large multinationals: GLAXO, ABOT and HALEON
The three biggest pharma stocks are local arms of global groups. They share a profile: almost no debt (debt is about 0.01 times equity at each), high returns on equity and regular dividends. GSK Pakistan (GLAXO) is the largest at Rs 104.9 bn, with a P/E of 9.6, an ROE of 31.5% and a trailing dividend yield of 5.8%. Abbott Pakistan (ABOT) trades at a P/E of 10.2 with an ROE of 26.7%. Haleon Pakistan (HALEON), which sells consumer health products such as pain relief and oral care, has the highest ROE of the three at 39.3% and a P/E of 12.0.
All three are KSE-100 members but none is in the KMI-30 Shariah index in our data. Their share prices are down between 13% and 22% over the past year.
Local manufacturers: HINOON, SEARL, AGP and others
Highnoon Laboratories (HINOON) has the longest dividend record in the group, with payouts in each of the last 20 years in our data, and an ROE of 30.1%. Our checks flag that its operating cash flow last year was under half of its net profit, which is worth watching. AGP has grown sales at about 33% a year over five years, the fastest of the larger names, but our checks note that profit has not kept pace with sales, and it carries more debt than the multinationals at 0.85 times equity.
Searle (SEARL) stands out for the wrong reasons on these numbers. Its net margin over the last twelve months is only 1.8% and its ROE 1.9%, which puts it on a P/E of 65.8. Our checks also flag slow collections: about 163 days of sales are tied up in receivables, against a sector median of 29. SEARL and Citi Pharma (CPHL) are the two pharma stocks in the KMI-30 in our data. Hoechst Pakistan (HPL) is not in the KSE-100 but has the highest Pulse Score in the sector, an ROE of 41.6% and a trailing yield of 6.8%.
Pulse Score and fair value for pharma stocks
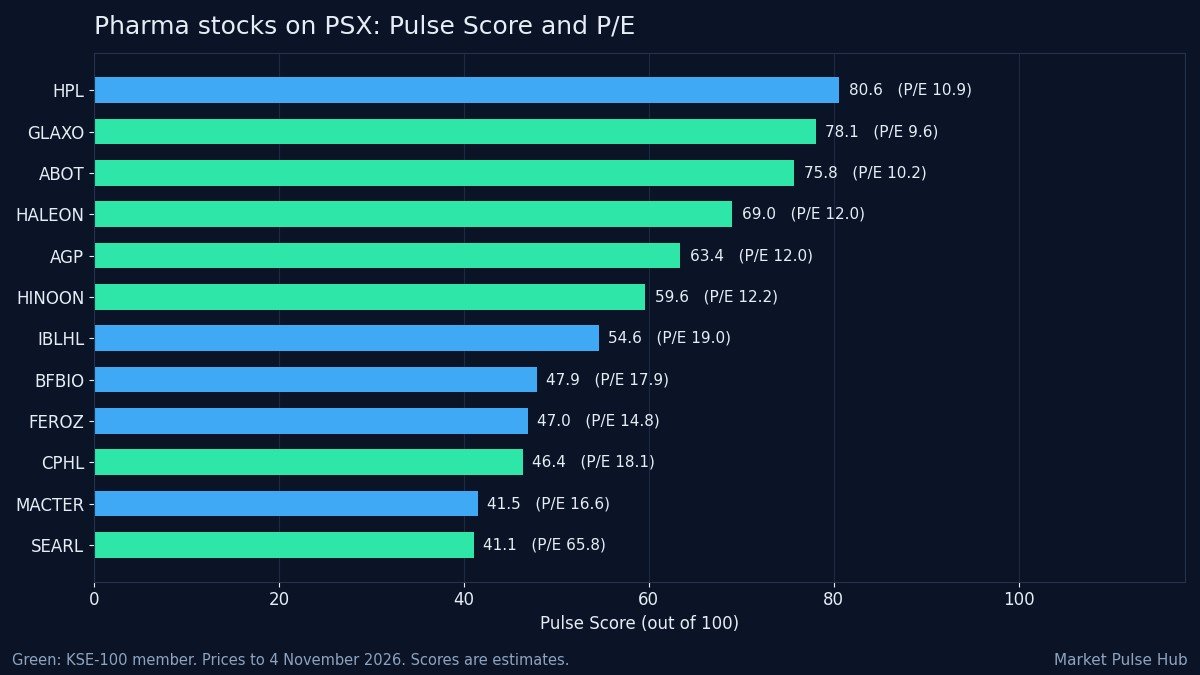
The Pulse Score is our score out of 100 that sums up a company’s growth, financial stability, valuation, working capital and cash flow, based on its reported results. A higher score means more of these checks look healthy; it is an estimate, not a forecast. Fair value is our estimate of what a share could be worth, blended from several valuation models such as discounted cash flow and an earnings-based method. Margin of safety is how far the price is below that estimate. Read more in our guide to intrinsic value and margin of safety.
| Stock | Pulse Score (out of 100) | Fair value estimate (Rs) | Price (Rs) | Margin of safety | 1-year price change |
|---|---|---|---|---|---|
| HPL | 80.6 | 6,255 | 3,965.01 | 36.6% | -3.6% |
| GLAXO | 78.1 | 574 | 329.51 | 42.6% | -17.4% |
| ABOT | 75.8 | 1,383 | 969.50 | 29.9% | -13.4% |
| HALEON | 69.0 | 898 | 669.26 | 25.5% | -21.6% |
| AGP | 63.4 | 228 | 151.58 | 33.6% | -21.7% |
| HINOON | 59.6 | 1,275 | 957.55 | 24.9% | -15.7% |
| IBLHL | 54.6 | 84 | 41.48 | 50.8% | -11.2% |
| BFBIO | 47.9 | 125 | 132.92 | -6.2% | -13.8% |
| FEROZ | 47.0 | 342 | 355.09 | -4.0% | -11.3% |
| CPHL | 46.4 | 49 | 62.46 | -28.7% | -25.4% |
| MACTER | 41.5 | 241 | 227.91 | 5.5% | -34.3% |
| SEARL | 41.1 | 24 | 76.66 | -221.0% | -31.5% |
A negative margin of safety means the price is above our fair value estimate. Fair value models are sensitive to their inputs, so treat these figures as a rough guide to relative value rather than price targets. The 1-year price change runs from 31 October 2025 to 4 November 2026 (30 October 2025 for HPL).
Latest quarterly results
The table shows profit after tax for the quarter to 30 September 2026 against the same quarter of 2025. For some companies this is the third quarter of their financial year and for others, with a June year end, it is the first. Figures come from each company’s results filing or from the exchange’s results summary, as shown. Where both sources are in our data they can differ, for example because one shows group (consolidated) figures and the other the company alone.
| Stock | Source | Profit, quarter to 30 Sep 2026 | Same quarter 2025 | Change |
|---|---|---|---|---|
| ABOT | Company results filing | Rs 2.54 bn | Rs 1.82 bn | +39.6% |
| GLAXO | Company results filing | Rs 2.61 bn | Rs 2.04 bn | +28.1% |
| HALEON | Company results filing | Rs 1.53 bn | Rs 1.62 bn | -5.4% |
| SEARL | Company results filing | Rs 1.15 bn | Rs 903 M | +26.9% |
| HINOON | Company results filing | Rs 931 M | Rs 945 M | -1.5% |
| AGP | Company results filing | Rs 850 M | Rs 1.05 bn | -18.9% |
| CPHL | Company results filing | Rs 249 M | Rs 204 M | +22.1% |
| HPL | Exchange results summary | Rs 614 M | Rs 876 M | -29.8% |
| FEROZ | Exchange results summary | Rs 220 M | Rs 182 M | +20.4% |
| BFBIO | Exchange results summary | Rs 185 M | Rs 160 M | +15.9% |
| MACTER | Exchange results summary | Rs 99 M | Rs 156 M | -36.6% |
Abbott had the strongest quarter, with profit up 39.6%, and GLAXO’s profit rose 28.1% (see our GLAXO results report). SEARL’s profit rose 26.9% on sales up about 15%. AGP’s profit fell 18.9% (see our AGP results report), and HPL’s fell 29.8%. IBL Healthcare’s latest figures in our data are for the full year to June 2026, so it is not in the table.
What drives pharma company profits
- Drug pricing: how quickly companies can raise the prices of their medicines to cover higher costs has a direct effect on margins.
- The rupee: much of the sector’s raw material is imported, so a weaker rupee raises costs.
- Collections and inventory: sales to distributors, hospitals and government buyers can take months to be paid. Long receivable days, as flagged for SEARL, tie up cash.
- Interest rates: companies with debt, such as AGP and SEARL, pay less interest when the SBP policy rate falls.
- Product launches and exports: new products and export markets drive growth for the local manufacturers.
How to use this comparison
A low P/E or a high yield on its own does not make a stock attractive. Check whether profit is backed by cash flow, whether receivables are rising and whether margins are stable. Each company has its own page with full ratios, dividends and results on the Market Pulse Hub dashboard. To see how pharma names compare with the rest of the index, see our KSE-100 companies list.
Frequently asked questions
Which is the largest pharma company on the PSX?
By market value, GlaxoSmithKline Pakistan (GLAXO) was the largest listed pharmaceutical company on 4 November 2026, worth about Rs 104.9 bn, followed by Abbott Pakistan (ABOT) at about Rs 94.9 bn.
Which pharma stock has the highest dividend yield?
On dividends declared over the last twelve months, Hoechst Pakistan (HPL) had the highest yield in the sector at about 6.8%, followed by GLAXO at 5.8% and HINOON at 5.2%. Past dividends do not guarantee future payments.
Which pharma stocks are Shariah-compliant?
Searle (SEARL) and Citi Pharma (CPHL) were members of the KMI-30 index in our latest data. Index membership is reviewed regularly, so check the latest KMI-30 stocks list.
Why is SEARL’s P/E so high?
Searle earned a net margin of only 1.8% over the last twelve months, so its earnings per share are small next to its share price. That pushes the P/E to 65.8 even after a fall of about 31% in the share price over the year.
Why have pharma stocks fallen this year?
Our data shows the falls but does not explain them. All 12 stocks are down over the year, with a median fall of about 16.5%, while the KSE-100 rose. Company results, pricing news and investor flows into other sectors can all play a part.
Use the free Market Pulse Hub dashboard to check these numbers yourself, and join the waitlist to get new tools and reports first.
Bilal, Market Pulse Hub
Figures are from company results, exchange data and our calculations up to 4 November 2026 and will change as new data arrives. This article is for education only and is not investment advice.