Power sector stocks PSX investors follow are mostly independent power producers (IPPs) that sell electricity under long-term contracts, plus K-Electric, which generates and distributes power in Karachi. This guide compares the 10 power companies in our data, including HUBC, KAPCO, NPL and NCPL, on valuation, dividends, collections, Pulse Score and their latest results, using exchange data and company reports up to 5 November 2026.
The power sector on the PSX
Our data covers 10 companies in the exchange’s “power generation and distribution” sector, with a combined market value of about Rs 523.06 bn. Hub Power (HUBC) alone is worth Rs 269.87 bn, about 52% of the sector, and K-Electric (KEL) is the second largest at Rs 169.56 bn. Five of the companies are in the KSE-100: HUBC, KEL, KAPCO, NPL and NCPL. Together they made up about 5.1% of the index on 5 November 2026, and HUBC alone 4.14%. HUBC is also the only one in the KMI-30 Shariah index.
Most IPPs earn a regulated return on their plants, paid by the state power buyer under their contracts. That makes their profits steadier than in many sectors, but it also means their cash depends on how quickly the buyer pays its bills. This is why receivable days, the average number of days a company waits to be paid, matter so much for power stocks (see our explainer on receivable days).
Power sector stocks PSX comparison table
P/E is the share price divided by the last twelve months of earnings per share (see our P/E ratio explainer). Dividend yield is the cash dividends paid over the last twelve months divided by the price (see dividend yield explained). ROE is net profit divided by shareholders’ equity.
| Stock | Company | Price (Rs) | Market cap | P/E | P/B | Dividend yield | ROE | Receivable days | KSE-100 |
|---|---|---|---|---|---|---|---|---|---|
| HUBC | Hub Power Co. Ltd. | 208.05 | Rs 269.87 bn | 5.3x | 1.09x | 10.6% | 18.9% | 275 | Yes |
| KEL | K-Electric Ltd. | 6.14 | Rs 169.56 bn | – | – | – | – | – | Yes |
| KAPCO | Kot Addu Power Co. Ltd. | 25.03 | Rs 22.03 bn | 7.3x | 0.39x | 12.5% | 5.3% | 170 | Yes |
| NPL | Nishat Power Limited | 52.90 | Rs 18.73 bn | 7.7x | 0.63x | 4.5% | 8.2% | 140 | Yes |
| NCPL | Nishat Chunian Power Limited | 50.05 | Rs 18.39 bn | 7.4x | 0.73x | 4.8% | 9.8% | 143 | Yes |
| PKGP | Pakgen Power Limited | 29.49 | Rs 10.97 bn | – | 0.42x | – | -2.7% | 2,770 | No |
| EPQL | Engro Powergen Qadirpur Ltd | 24.01 | Rs 7.77 bn | 11.3x | 0.67x | 12.3% | 5.9% | 213 | No |
| SPWL | Saif Power Ltd | 7.64 | Rs 2.95 bn | 15.1x | – | 20.9% | 1.9% | 269 | No |
| KOHE | Kohinoor Energy Limited | 14.82 | Rs 2.51 bn | 2.5x | 0.48x | – | 19.5% | 119 | No |
| KOHP | Kohinoor Power Co. Ltd. | 21.73 | Rs 274 M | – | – | – | -3.3% | 1,022 | No |
Prices are closing prices on 5 November 2026. A dash means the figure is not available or not meaningful, for example a P/E for a company with losses. K-Electric’s recent ratios were not available in our data, so it is shown for size only. The sector median for receivable days in our data is 269.
Hub Power (HUBC): the sector heavyweight
Hub Power trades at Rs 208.05, on a P/E of 5.3 and 1.09 times book value, with an ROE of 18.9%, the highest of the larger names. Its trailing dividend yield is 10.6% and it has paid a dividend in 8 of the last 10 years in our data, with a payout ratio of about 52% of earnings. Debt is moderate at 0.28 times equity. The weak spot is cash collection: receivable days of 275 are slightly above the sector median, and our checks flag slow collections. The share price is down 5.6% over the year to 5 November 2026, while the KSE-100 rose 7.7%.
KAPCO, Nishat Power and Nishat Chunian Power
Kot Addu Power (KAPCO) is the cheapest of the group on book value at 0.39 times, and has the highest yield among the KSE-100 power names at 12.5%. It has paid a dividend in each of the last 10 years in our data. Its ROE is low at 5.3%, and our checks flag negative operating cash flow last year and earnings that were not well backed by cash. The shares are down 18.0% over the year.
Nishat Power (NPL) and Nishat Chunian Power (NCPL) have been the standout performers, with share prices up 54.1% and 94.7% over the year. Both trade below book value (0.63 and 0.73 times) on P/E ratios of 7.7 and 7.4, with little debt. Their dividend yields are lower, at 4.5% and 4.8%. They collect faster than the sector, at about 140 and 143 receivable days, but like KAPCO they had negative operating cash flow last year in our data.
Smaller power stocks: high yields need checking
Some of the highest dividend yields on the exchange are in small power stocks. Saif Power (SPWL) shows a trailing yield of 20.9% and Engro Powergen Qadirpur (EPQL) 12.3%. In both cases the dividends paid were larger than earnings, with payout ratios of about 347% and 142%, which is hard to keep up if profits do not rise. A high trailing yield tells you what was paid, not what will be paid; our guide to the dividend payout ratio explains why this matters.
Kohinoor Energy (KOHE) has the lowest P/E in the group at 2.5 with an ROE of 19.5%, but our checks flag a very low tax ratio and profit growth well ahead of operating profit. Pakgen Power (PKGP) and Kohinoor Power (KOHP) are loss-making in our data and have extremely long receivable periods, of about 2,770 and 1,022 days.
Pulse Score and fair value for power stocks
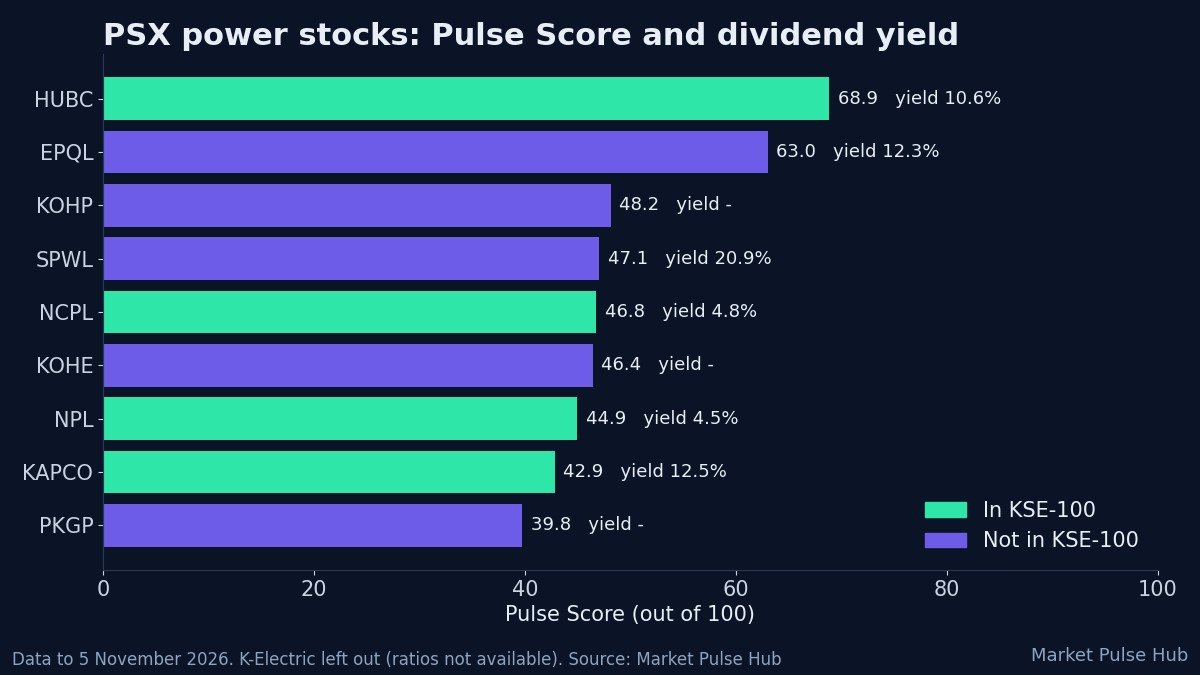
The Pulse Score is our score out of 100 that sums up a company’s growth, financial stability, valuation, working capital and cash flow, based on its reported results. A higher score means more of these checks look healthy; it is an estimate, not a forecast. Fair value is our estimate of what a share could be worth, blended from several valuation models such as discounted cash flow and an earnings-based method. Margin of safety is how far the price is below that estimate (see our guide to intrinsic value and margin of safety).
| Stock | Pulse Score (out of 100) | Fair value estimate (Rs) | Price (Rs) | Margin of safety | 1-year price change |
|---|---|---|---|---|---|
| HUBC | 68.9 | 693 | 208.05 | 70.0% | -5.6% |
| EPQL | 63.0 | 59 | 24.01 | 59.2% | -17.2% |
| KOHP | 48.2 | 9 | 21.73 | -141.6% | -51.7% |
| SPWL | 47.1 | 39 | 7.64 | 80.2% | -28.1% |
| NCPL | 46.8 | 124 | 50.05 | 59.6% | +94.7% |
| KOHE | 46.4 | 88 | 14.82 | 83.2% | -17.5% |
| NPL | 44.9 | 146 | 52.90 | 63.8% | +54.1% |
| KAPCO | 42.9 | 101 | 25.03 | 75.2% | -18.0% |
| PKGP | 39.8 | 352 | 29.49 | 91.6% | -53.4% |
A negative margin of safety means the price is above our fair value estimate. Power stocks often show large margins of safety because their reported earnings are high relative to price, but the models cannot fully allow for slow collections, contract expiries or renegotiated tariffs, so treat these fair values with extra caution. The 1-year price change runs from 3 November 2025 to 5 November 2026.
Latest quarterly results
The table shows profit after tax for the latest quarter, against the same quarter a year earlier, from the exchange’s results summary in our data. Most of these companies have a June year end, so the quarter to 30 September 2026 is the first quarter of their 2027 financial year; EPQL and PKGP have a December year end, so for them it is the third quarter of 2026.
| Stock | Profit, quarter to 30 Sep 2026 | Same quarter 2025 | EPS (Rs) | EPS a year earlier | Change |
|---|---|---|---|---|---|
| HUBC | Rs 8.12 bn | Rs 7.89 bn | 6.26 | 6.09 | +2.8% |
| KAPCO | Rs 500 M | Rs 4.9 M | 0.57 | 0.01 | n/m |
| NPL | Rs 541 M | Rs 584 M | 1.53 | 1.65 | -7.3% |
| NCPL | Rs 558 M | Rs 552 M | 1.52 | 1.50 | +1.1% |
| EPQL | Rs 354 M | Rs 391 M | 1.09 | 1.21 | -9.6% |
| KOHE | Rs 412 M | Rs 140 M | 2.43 | 0.82 | +195.2% |
| SPWL | Rs 11.4 M | Loss of Rs 65.7 M | 0.03 | -0.17 | n/m |
| PKGP | Loss of Rs 237 M | Rs 116 M | -1.23 | 0.31 | n/m |
| KOHP | Rs 0.965 M | Rs 1.4 M | 0.08 | 0.11 | -31.9% |
n/m means the change is not meaningful because the earlier figure was very small or one of the figures is a loss. For Hub Power, the company’s results filing shows larger group figures: profit of Rs 12.79 bn against Rs 11.63 bn a year earlier (+10.0%), and EPS of Rs 9.86 against Rs 8.96. The smaller figures in the table appear to be for the parent company alone. KAPCO’s jump comes from a very low base in the same quarter of 2025.
What drives power company profits and dividends
- Collections: profits are often booked long before the cash arrives. When payments from the power buyer speed up, IPPs can pay larger dividends; when they slow, dividends can be cut even if profit holds.
- Contract terms: tariffs and the remaining life of each plant’s contract decide future earnings. Changes to contracts can reset profits and fair values.
- Interest rates: lower SBP policy rates reduce finance costs for indebted plants, but also reduce late-payment income that some IPPs earn on overdue receivables.
- The rupee: parts of many IPP tariffs are linked to the US dollar, so rupee moves can change rupee profits.
Look beyond the dividend yield. Check receivable days, whether profit is backed by operating cash flow, and the payout ratio. Full ratios, dividends and results for each company are on the Market Pulse Hub dashboard, our highest dividend yield stocks list shows how these names compare with other sectors, and the KSE-100 companies list shows every index member.
Frequently asked questions
Which is the largest power stock on the PSX?
Hub Power (HUBC) is the largest, with a market value of about Rs 269.87 bn on 5 November 2026, followed by K-Electric (KEL) at about Rs 169.56 bn.
Which power stocks are in the KSE-100?
HUBC, KEL, KAPCO, NPL and NCPL. Together they made up about 5.1% of the index on 5 November 2026.
Do power stocks pay high dividends?
Many do. In our data HUBC, KAPCO, EPQL and SPWL had trailing dividend yields above 10%. Some of these payouts were larger than earnings, and past dividends do not guarantee future payments.
Why are receivable days so high for power companies?
IPPs sell their electricity to the state power buyer and are paid in arrears. When the power sector is short of cash, payments are delayed, so IPPs can show large profits while waiting months for the cash.
Are power stocks Shariah-compliant?
Among the power stocks in our data, only Hub Power (HUBC) was in the KMI-30 index in our latest data. Check the current KMI-30 stocks list, as membership is reviewed regularly.
Use the free Market Pulse Hub dashboard to check these numbers yourself, and join the waitlist to get new tools and reports first.
Bilal, Market Pulse Hub
Figures are from company results, exchange data and our calculations up to 5 November 2026 and will change as new data arrives. This article is for education only and is not investment advice.